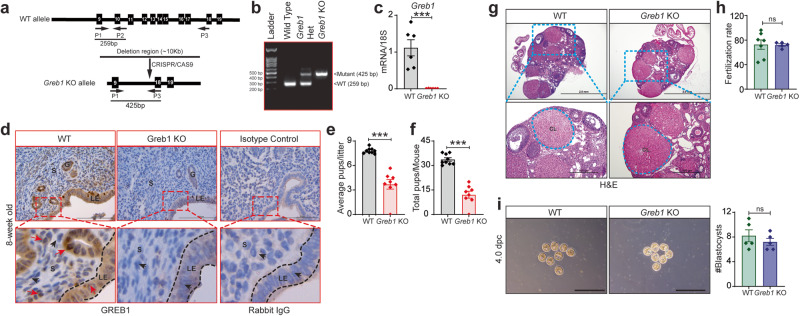
Fig. 4. Greb1 knockout (Greb1 KO) mice have impaired fertility.
a Schematic of Greb1 knockout strategy. b Confirmation of wild type (WT) and mutant alleles by PCR. Representative image of PCR, observed in at least five specimens from different mice c Analysis of Greb1 transcripts in uteri from WT (n = 6) and Greb1 KO mice (n = 6). Paired, two-tailed, t-test. Data reported as the mean ± SEM. *P < 0.05, ***P < 0.001, ****P < 0.0001. d Representative cross-sectional images of uteri from WT and Greb1 KO mice stained for GREB1 by immunohistochemistry. Scale bar, 200 μm; Red arrow, GREB1-positive cells; black arrow, GREB1-negative cells. G, glandular epithelia; LE, luminal epithelia; S, stroma. Representative image of at least three specimens analyzed per genotype. e, f, Graphs depicting the number of pups per litter and the total number of pups per mice from WT (n = 9) and Greb1 KO (n = 8) in six-month fertility tests. Paired, two-tailed, t-test. Data reported as the mean ± SEM. *P < 0.05, ***P < 0.001, ****P < 0.0001. g Representative (n = 5) Hematoxylin and Eosin-stained cross-section images of the ovary from 8-week-old WT and Greb1 KO mice; scale bar: 2.0 mm and 200 μm. CL corpus luteum. Representative image of at least five specimens analyzed per genotype. h In vitro fertilization rate of oocytes recovered from 4-week-old WT (n = 7) and Greb1 KO mice (n = 5). Paired, two-tailed, t-test. Data reported as the mean ± SEM. *P < 0.05, ***P < 0.001, ****P < 0.0001. i Representative images and quantification of blastocysts (graph on right) retrieved from WT (n = 5) and Greb1 KO (n = 5) mice on 4 dpc. Paired, two-tailed, t-test. Data are presented as mean ± SEM, (n = 5-9 WT and n = 5-8 Greb1 KO). ***P < 0.001 and ns, non-significant.

