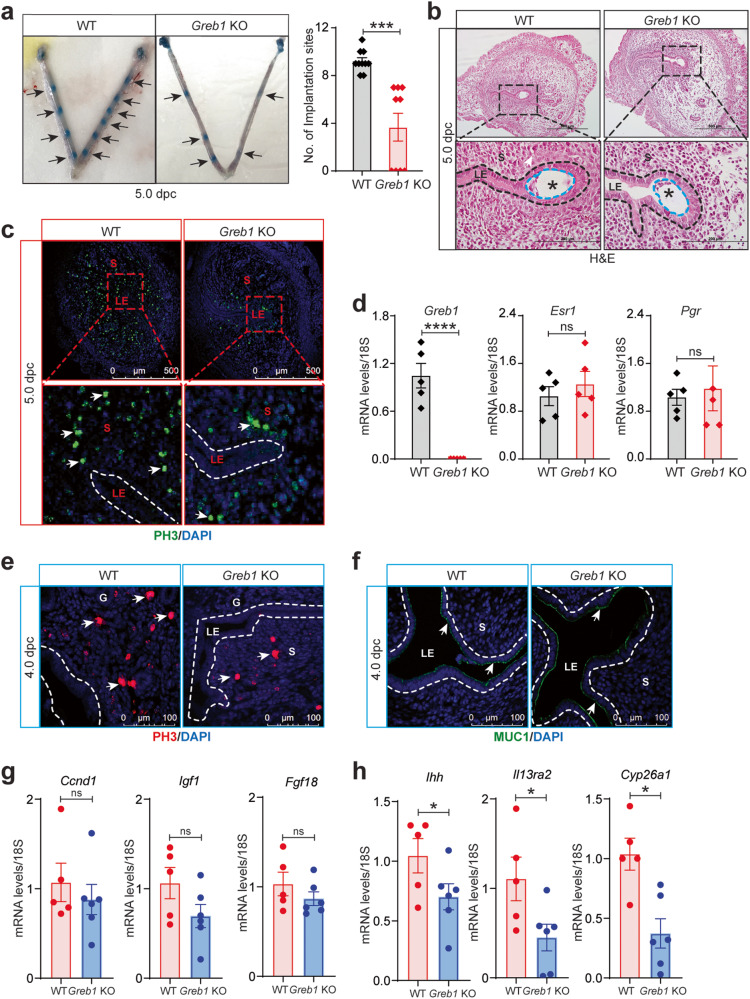
Fig. 5. Greb1 KO mice have impaired embryo implantation and uterine receptivity.
a Embryo implantation sites at 5 dpc in WT (n = 10) and Greb1 KO (n = 11) mice. Black arrows indicate the implantation sites. Paired, two-tailed, t-test, data reported as the mean ± SEM. *P < 0.05, ***P < 0.001, ****P < 0.0001. b Representative Hematoxylin and Eosin-stained cross-section images of the uterus at 5 dpc in WT and Greb1 KO mice; scale bars, 500 μm and 200 μm. Representative image of at least three specimens analyzed per genotype. c Representative cross-sectional images of uteri of WT and Greb1 KO mice at 5 dpc stained for Phospho-Histone H3, scale bar 500 μm. White arrows indicate positive cells. Representative image of at least three specimens analyzed per genotype. d Relative mRNA expression of indicated genes at 5 dpc in WT and Greb1 KO females. Paired, two-tailed, t test, data reported as the mean ± SEM. *P < 0.05, ***P < 0.001, ****P < 0.0001 and ns, non-significant e, f, Representative cross-sectional images of WT and Greb1 KO mice at 4 dpc uteri stained for Phospho-Histone H3 (e), and MUC1 (f) Representative image of at least three specimens analyzed per genotype. g Relative mRNA levels of estrogen target genes Ccnd1, Igf1 and Fgf18, and h progesterone target genes Ihh, Il13ra2 and Cyp26a1, in the uteri of Greb1 KO and WT mice at dpc 4 (n = 5 for each genotype). Asterisks denote the blastocysts. LE, luminal epithelia; S, stroma. Scale bar, 100 μm. Paired, two-tailed, t-test, data are presented as mean ± SEM (n = 5–6 mice per group). ***P < 0.001, ****P < 0.0001, and ns, non-significant.

