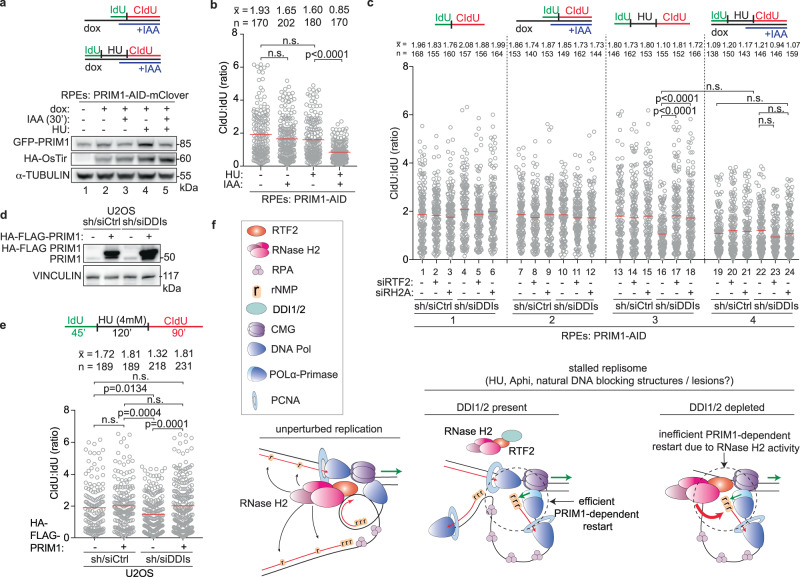
Fig. 9. Replication restart is exquisitely sensitive to cellular levels of PRIM1.
a Top: Schematic of labeling scheme. Dox was used to induce expression of HA-OsTir enzyme for targeted PRIM1-AID-mClover degradation. PBS washes are indicated by a black vertical line in all schematics. Bottom: Representative immunoblot of PRIM1 levels in endogenously edited PRIM1-AID-mClover RPE cells following indicated treatments. Lane 3 normalized expression of GFP-PRIM1 is 16% less than the normalized expression in lane 2. Lane 5 normalized expression of GFP-PRIM1 is 24% less than the normalized expression in lane 4. b Quantification of representative experiment of CldU:IdU tract length ratio in cells from experiment in (a). c Top: Schematic of labeling scheme. Quantification of representative experiment of CldU:IdU tract length ratio. d Immunoblot of HA-FLAG-PRIM1 expression in control and DDI-depleted U2OS cells. e Top: Schematic of labeling scheme. Bottom: Quantification of representative experiment of CldU:IdU tract length ratio in cells from experiment in (d). f Model of RTF2’s function in localizing RNase H2 to the replisome during unpurturbed replication to allow for single ribonucleotide removal (left). Model of RTF2 and RNase H2 affecting PRIM1-dependent restart following replication stress (right). We speculate that in the DDI1/2-competent cells, RTF2 is removed from stalled replication forks through the activity of the DDI1/2 proteasome shuttle proteins, resulting secondarily in loss of RNase H2 and efficient restart that is dependent on the levels and catalytic activity of PRIM1. In DDI1/2-depleted cells, RTF2-RNase H2 are retained at stalled replication forks, opposing RNA primer deposition by PRIM1 and slowing replication restart after stalling. Experiments conducted at least three times in biological replicates with consistent results for (a)–(e). Mean is shown with red line for (b), (c), (e). Experiments were blinded prior to analysis for (b), (c), (e). Average CldU:IdU ratios are listed above each sample for (b), (c), (e). Outliers removed with ROUT (1%) for (b), (c), (e). Significance evaluated by Kruskal-Wallis ANOVA with a Dunn’s post-test. RH2A = RNASEH2A, Ctrl = Control. IAA = auxin. Source data are provided as a Source Data file.

