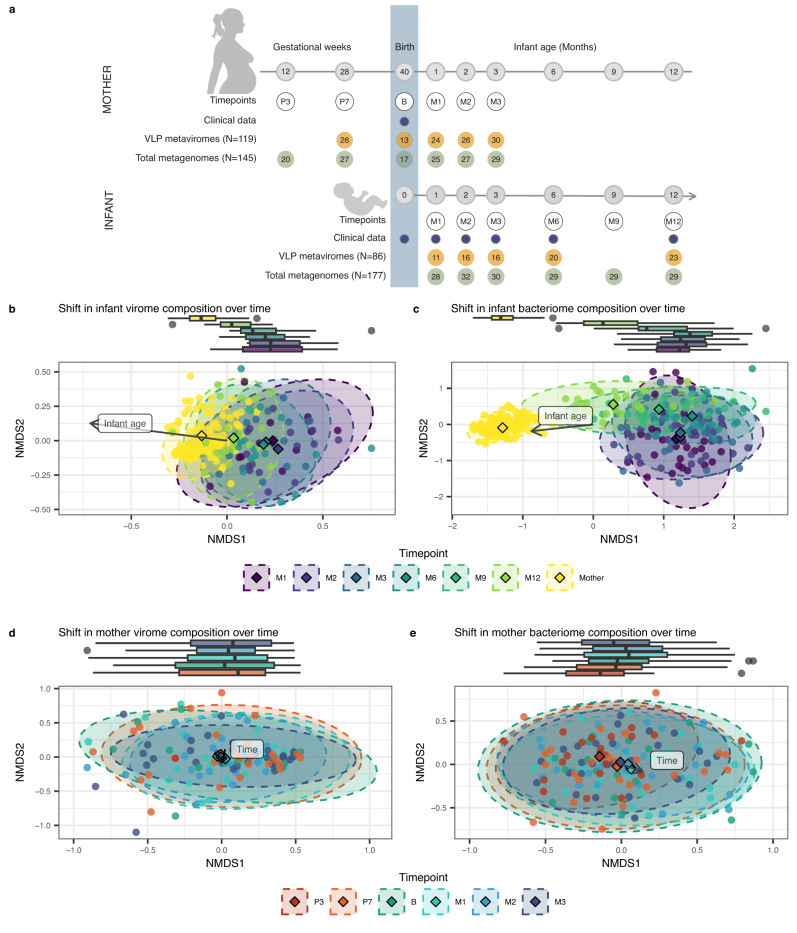
Fig. 1. Overall composition of the infant and maternal gut virome and bacteriome over the first year of life and during pregnancy.
a Timeline and availability of infant and maternal total metagenomes and virus-like particle (VLP) metaviromes. Faecal samples were collected at gestational weeks 12 and 28, at birth, and months 1, 2, 3, 6, 9 and 12 after birth (numbers in grey circles). Timepoints are displayed in black circles. Blue circles denote the availability of clinical data per timepoint (Supplementary Data 1). Numbers in green and yellow circles indicate the number of samples per timepoint. Non-metric multidimensional scaling (NMDS) analysis based on Bray-Curtis dissimilarity calculated at the level of (b) vOTUs, (c) bacterial species, (d) mother vOTUs and (e) mother bacterial species. Linear mixed-effects models (LMM) showed the significant effect of timepoint on NMDS 1 in infants at the level of vOTUs and bacterial species (p value = 1.1e-03 & p value = 2.0e-07), as well as the significant effect of sample type (mother or infant) on NMDS 1 at the level of vOTUs and bacterial species (p value = 1.5e-10 & p value = 3.6e-36). LMM showed no significant effect of timepoint on NMDS 1 at the level of mother vOTUs (p = 0.6) and a significant effect of timepoint on NMDS1 at the level of mother bacterial species (p value = 2.3e-4). Sample sizes for mothers and infants at each timepoint are shown in (a). In all graphs, each point represents one sample, and different colours indicate samples from various timepoints, and in (b), (c), mother samples are shown in yellow. The distance between points reflects the level of dissimilarity. Centroids of sample clusters from the same timepoints are shown as diamonds in respective colours. Ellipses of respective colours represent 95% confidence regions for each timepoint, assuming a multivariate t-distribution of the data points. Boxed labels with arrows indicate significant vectors determined by fitting them onto ordinations. The boxplots on top of NMDS plots depict the distribution of NMDS1 per timepoint. Each boxplot visualises the median, hinges (25th and 75th percentiles), and whiskers extending up to 1.5 times the interquartile range from the hinges. Source data are provided as a Source Data file.

