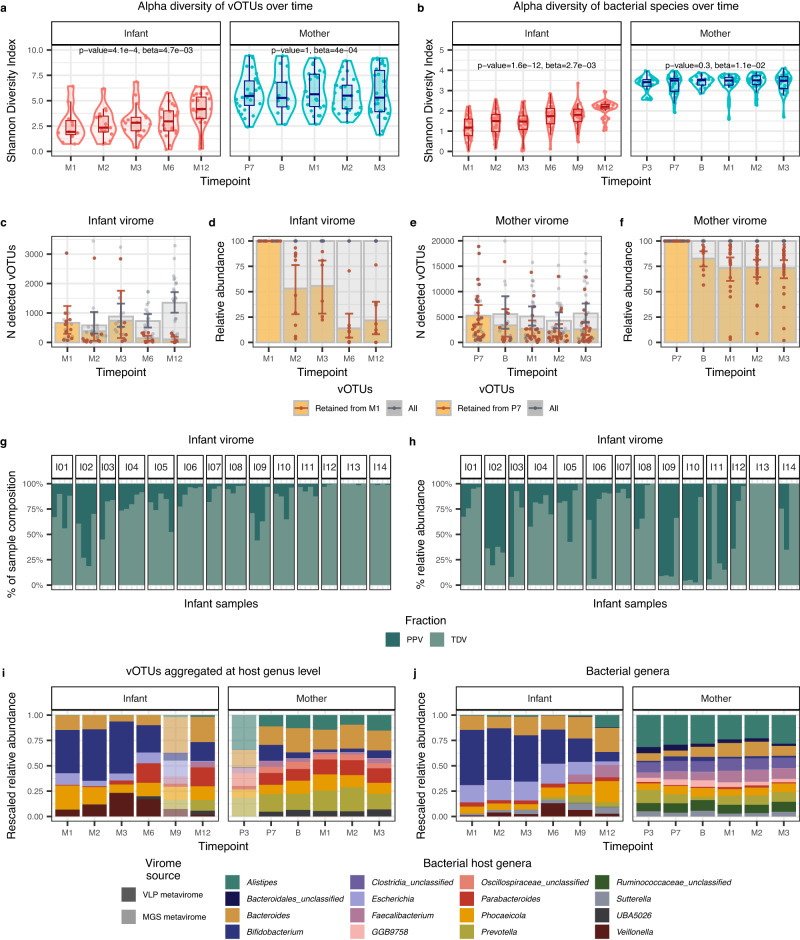
Fig. 2. Longitudinal dynamics of gut virome and bacteriome in infants and mothers.
a, b Alpha diversity, as measured by the Shannon Diversity Index, of (a), vOTUs and (b), bacterial species in mothers and infants over time. Boxplot colours represent infant (coral) or maternal (blue) samples. Boxplots visualise the median, hinges (25th and 75th percentiles), and whiskers extending up to 1.5 times the interquartile range from the hinges. Linear mixed-effects models showed a significant effect of timepoint on infant’s viral (p value = 4.1e-4) and bacterial diversities (p value = 1.6e-12), while timepoint did not have a significant effect on mothers’ viral (p value = 1) and bacterial diversities (p value = 0.3). Sample sizes are detailed in Fig. 1a. c, Number and d, relative abundance of vOTUs retained from month 1 in n = 11 infants at months 2 (n = 10), 3 (n = 6), 6 (n = 10), and 12 (n = 9) after birth. e, Number and f, the relative abundance of vOTUs retained from the 7th month of pregnancy in n = 26 mothers at birth (n = 11) and months 1 (n = 21), two (n = 23) and three (n = 26) after delivery. In (c)–(f), bar colours show retained (yellow) and all vOTUs (grey) per sample. The 95% confidence intervals (CI) for the means are depicted in brown and grey whiskers for retained and all vOTUs, respectively. g Percentage of infant VLP metaviromes composition and (h) the cumulative relative abundance of vOTUs classified into biome fractions based on vOTUs persistence in 14 infants with at least three longitudinal samples. Personal persistent viromes (PPV, shown in deep teal) include vOTUs present in >= 75% of an individual’s samples. Transiently detected viromes (TDV, shown in muted seafoam) include vOTUs present in less than 75% of the samples of an individual. i, j Stacked bar plots showing the top-10 most abundant vOTU aggregates by their bacterial hosts at the genus level and (j) top-10 abundant bacterial genera in infants and mothers. The relative abundance of vOTUs and bacterial genera was rescaled to fit to 1 after removing low abundant and unassigned groups. Translucent stacked bars indicate the MGS metaviromes for the timepoints that were unavailable for the VLP metavirome profiling. Opaque stacked bars indicate the VLP metaviromes. Source data are provided as a Source Data file.

