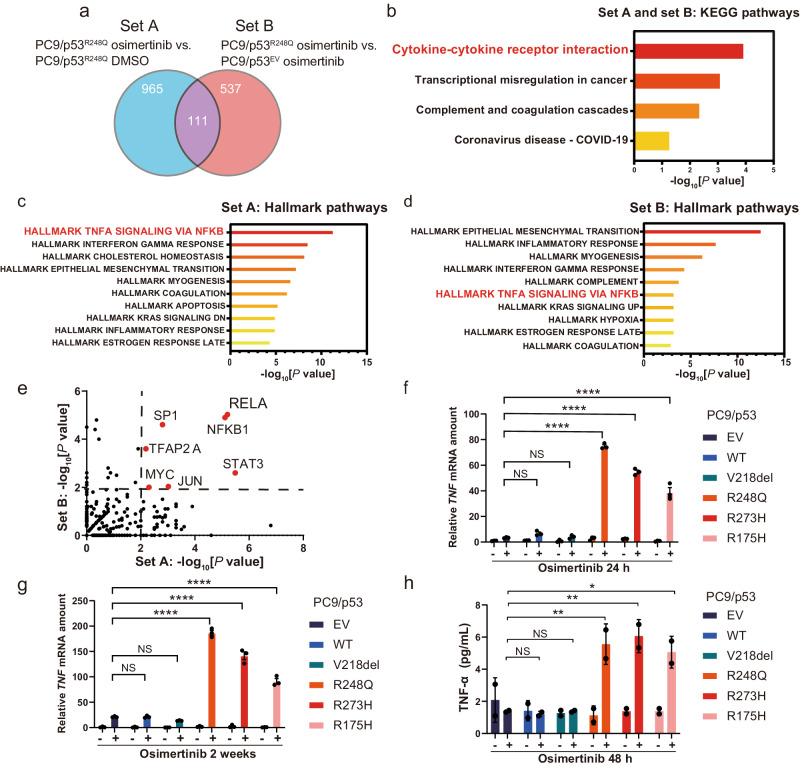
Fig. 3. TP53-GOF mutation promotes activation of TNF-α–NF-κB signaling by osimertinib in EGFR-mutated NSCLC cells.
a Venn diagram showing the overlap in the number of significantly upregulated (log2[fold change] > 1, p < 0.05) genes in set A (PC9/p53R248Q cells incubated with 600 nM osimertinib for 24 h versus those incubated with DMSO vehicle) and in set B (PC9/p53R248Q cells versus PC9/p53EV cells, each exposed to 600 nM osimertinib for 24 h) as determined by RNA-seq. b KEGG pathway analysis for the 111 genes commonly upregulated in sets A and B. Hallmark pathways with the highest −log10[p values] are shown. Pathway enrichment analysis for the significantly upregulated genes in set A (c) and set B (d). Hallmark gene sets with the highest −log10[p values] are shown. e Volcano plot based on −log10[p value] for TRRUST analysis of set A and set B. The dashed lines indicate a −log10[p value] of 2 (p = 0.01). RT-qPCR analysis of TNF mRNA abundance in PC9/p53EV, PC9/p53WT, and PC9/p53MUT cells incubated with or without 600 nM osimertinib for 24 h (f) or for 2 weeks (g). Data are means ± SEM of triplicates from one experiment and are representative of three independent experiments. h Concentration of TNF-α in serum-free culture supernatants of PC9/p53EV, PC9/p53WT, and PC9/p53MUT cells incubated in the absence or presence of 600 nM osimertinib for 48 h. Data are means ± SD for duplicates from one experiment and are representative of two independent experiments. *p < 0.05, **p < 0.01, ****p < 0.0001, NS not significant (one-way ANOVA followed by Tukey’s test).

