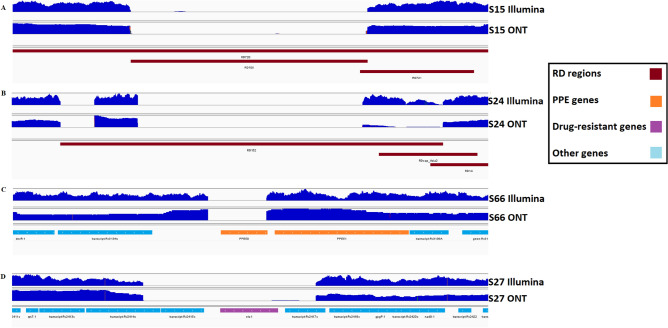
Figure 3.
Sequence coverage plots showing selected detected structural variants related to drug resistance and lineages (regions of difference, RD) identified in Oxford Nanopore Technologies (ONT) and Illumina (Illumina) platforms. Coverage is indicated by blue mounds with isolate labels on the side. (A) RD105 deletion confirmed in isolate S15 (lineage 2.2.1). All samples from lineage 2 contained this deletion; (B) RD152 deletion confirmed in isolate S24. While it does not span the entire deletion, a consistent pattern has been observed across all samples from lineage 2, suggesting shared deletion characteristics; (C) a deletion in the ppe50 gene in isolate S66 that was present across all lineage 1 strains; (D) an entire deletion of the eis gene in isolate S27, potentially linked to drug resistance.

