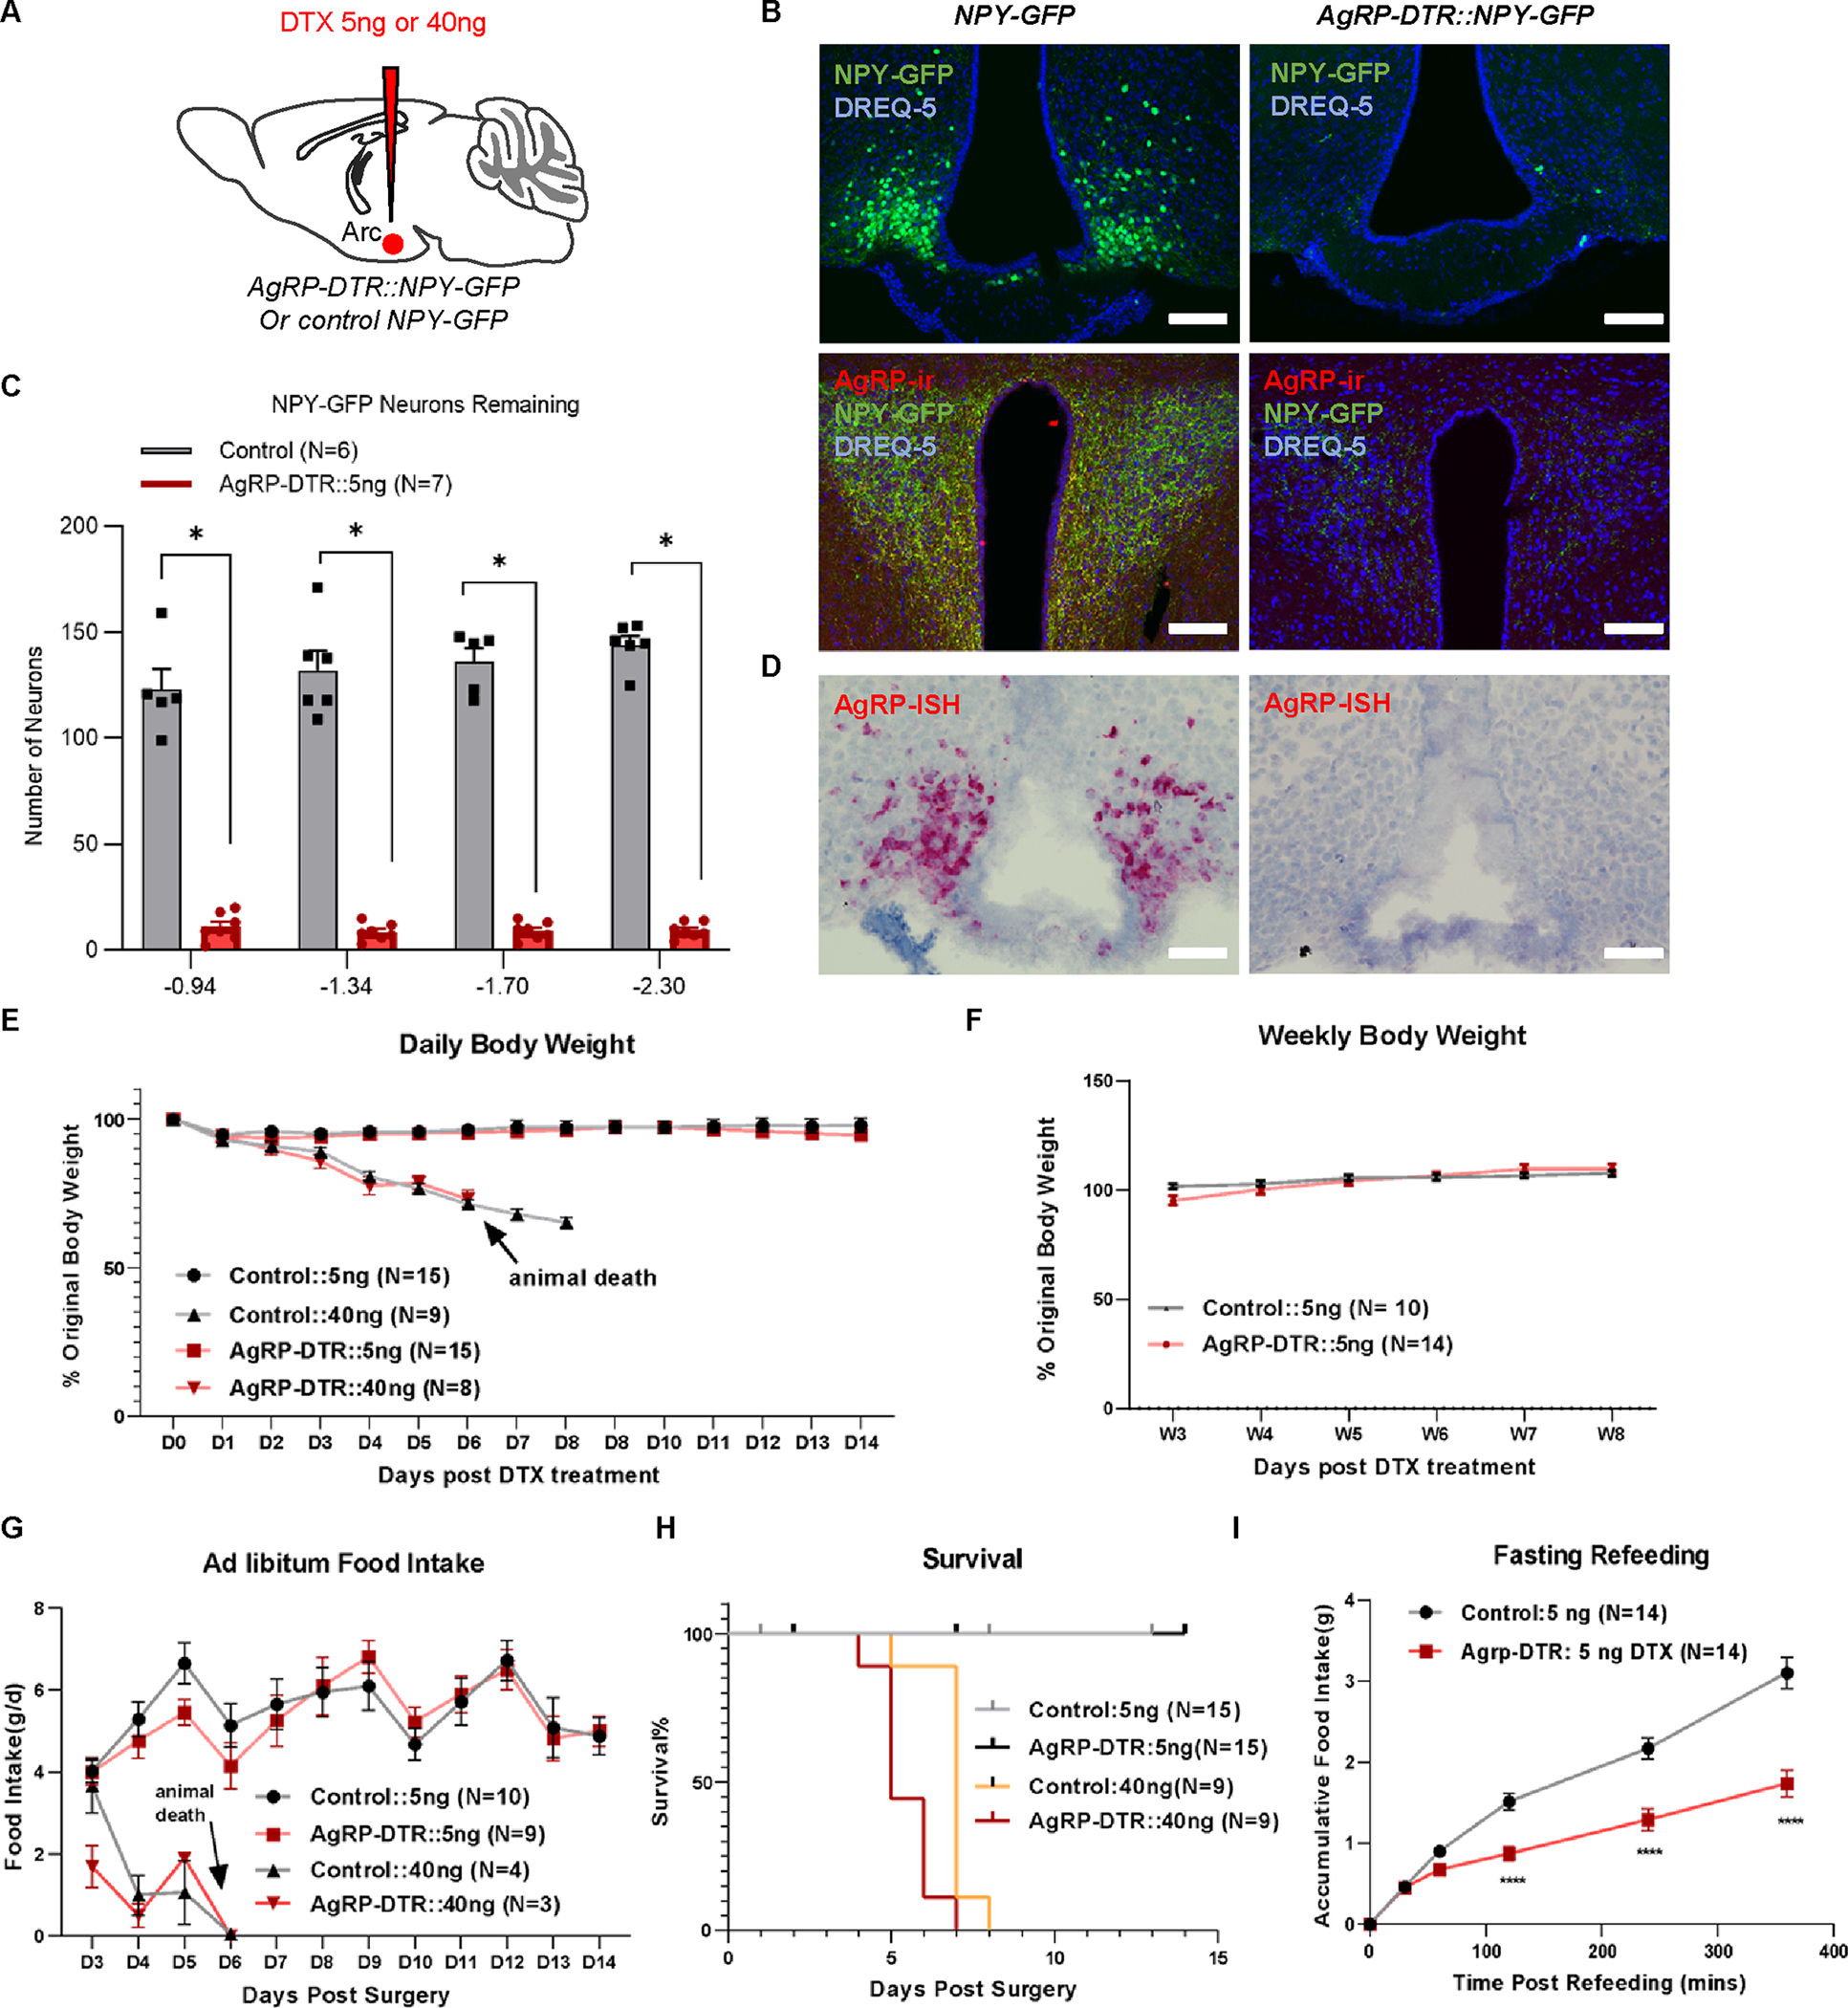
Figure 1. DTX-induced AgRP neuron lesions have no disruptions in energy balance.

A, Schematic of i.c.v. injections of DTX in mice with the indicated genotypes. B, Representative pictures showing NPY-GFP (green) and nuclear DREQ-5 nucleus signals (blue) in the ARC, and NPY-GFP, nuclear DREQ-5 and AgRP-immunoreactive (-ir) terminals in the PVN of control NPY-GFP (left panels) and AgRP-DTR::NPY-GFP mice (right panels) that received a single i.c.v. injections of 5 ng DTX. Scale bar = 100 μm. C, Quantification of remaining NPY-GFP-positive neurons in the ARC of different Bregma levels from control NPY-GFP and AgRP-DTR::NPY-GFP mice injected with 5 ng DTX at 8 weeks postinjection. Two-way repeated ANOVA followed by Bonferroni’s multiple comparisons; P < 0.0001 between control and AGRP-DTR mice at all Bregma levels. D, Representative pictures showing in situ hybridization (ISH) signals of AgRP in the ARC of control NPY-GFP (left panel) and AgRP-DTR::NPY-GFP mice (right panel). Scale bar = 100 μm. E, Daily percentage of original body weight of control and AgRP-DTR::NPY-GFP male mice with a single i.c.v. injection of 5 ng or 40 ng DTX during the 14 days after DTX injection. Two-way repeated ANOVA followed by Bonferroni’s multiple comparisons; p = 0.4267 between controls and AgRP-DTR mice injected with 5 ng DTX. F, Weekly percentage of original body weight of the control and 5 ng DTX groups 3~8 weeks post injection. Two-way repeated ANOVA followed by Bonferroni’s multiple comparisons; p = 0.6262 between controls and AgRP-DTR mice. G, Daily food intake in control and AgRP-DTR::NPY-GFP male mice with a single i.c.v. injection of 5 ng or 40 ng DTX. Two-way repeated ANOVA followed by Bonferroni’s multiple comparisons; p = 0.1402 between control and AgRP-DTR mice injected with 5 ng DTX. H, Survival curve in control and AgRP-DTR mice that received a single i.c.v. injections of either 5 ng or 40 ng DTX. p = 0.0544 between 5 ng and 40 ng DTX-injected control mice; p > 0.9999 between control and AgRP-DTR mice injected with 5 ng DTX. I, Fasting-refeeding curve. All the fasting-refeeding tests were conducted 2~4 weeks post injection. Two-way repeated ANOVA followed by Bonferroni’s multiple comparisons in control and AgRP-DTR::NPY-GFP mice that received a single i.c.v. injections of 5 ng DTX. Two-way repeated ANOVA followed by Bonferroni’s multiple comparisons; p < 0.0001 between control and AgRP-DTR mice injected with 5 ng DTX. ****p < 0.0001. All data represent the mean ± SEM.
See also Figures S1–S4.
