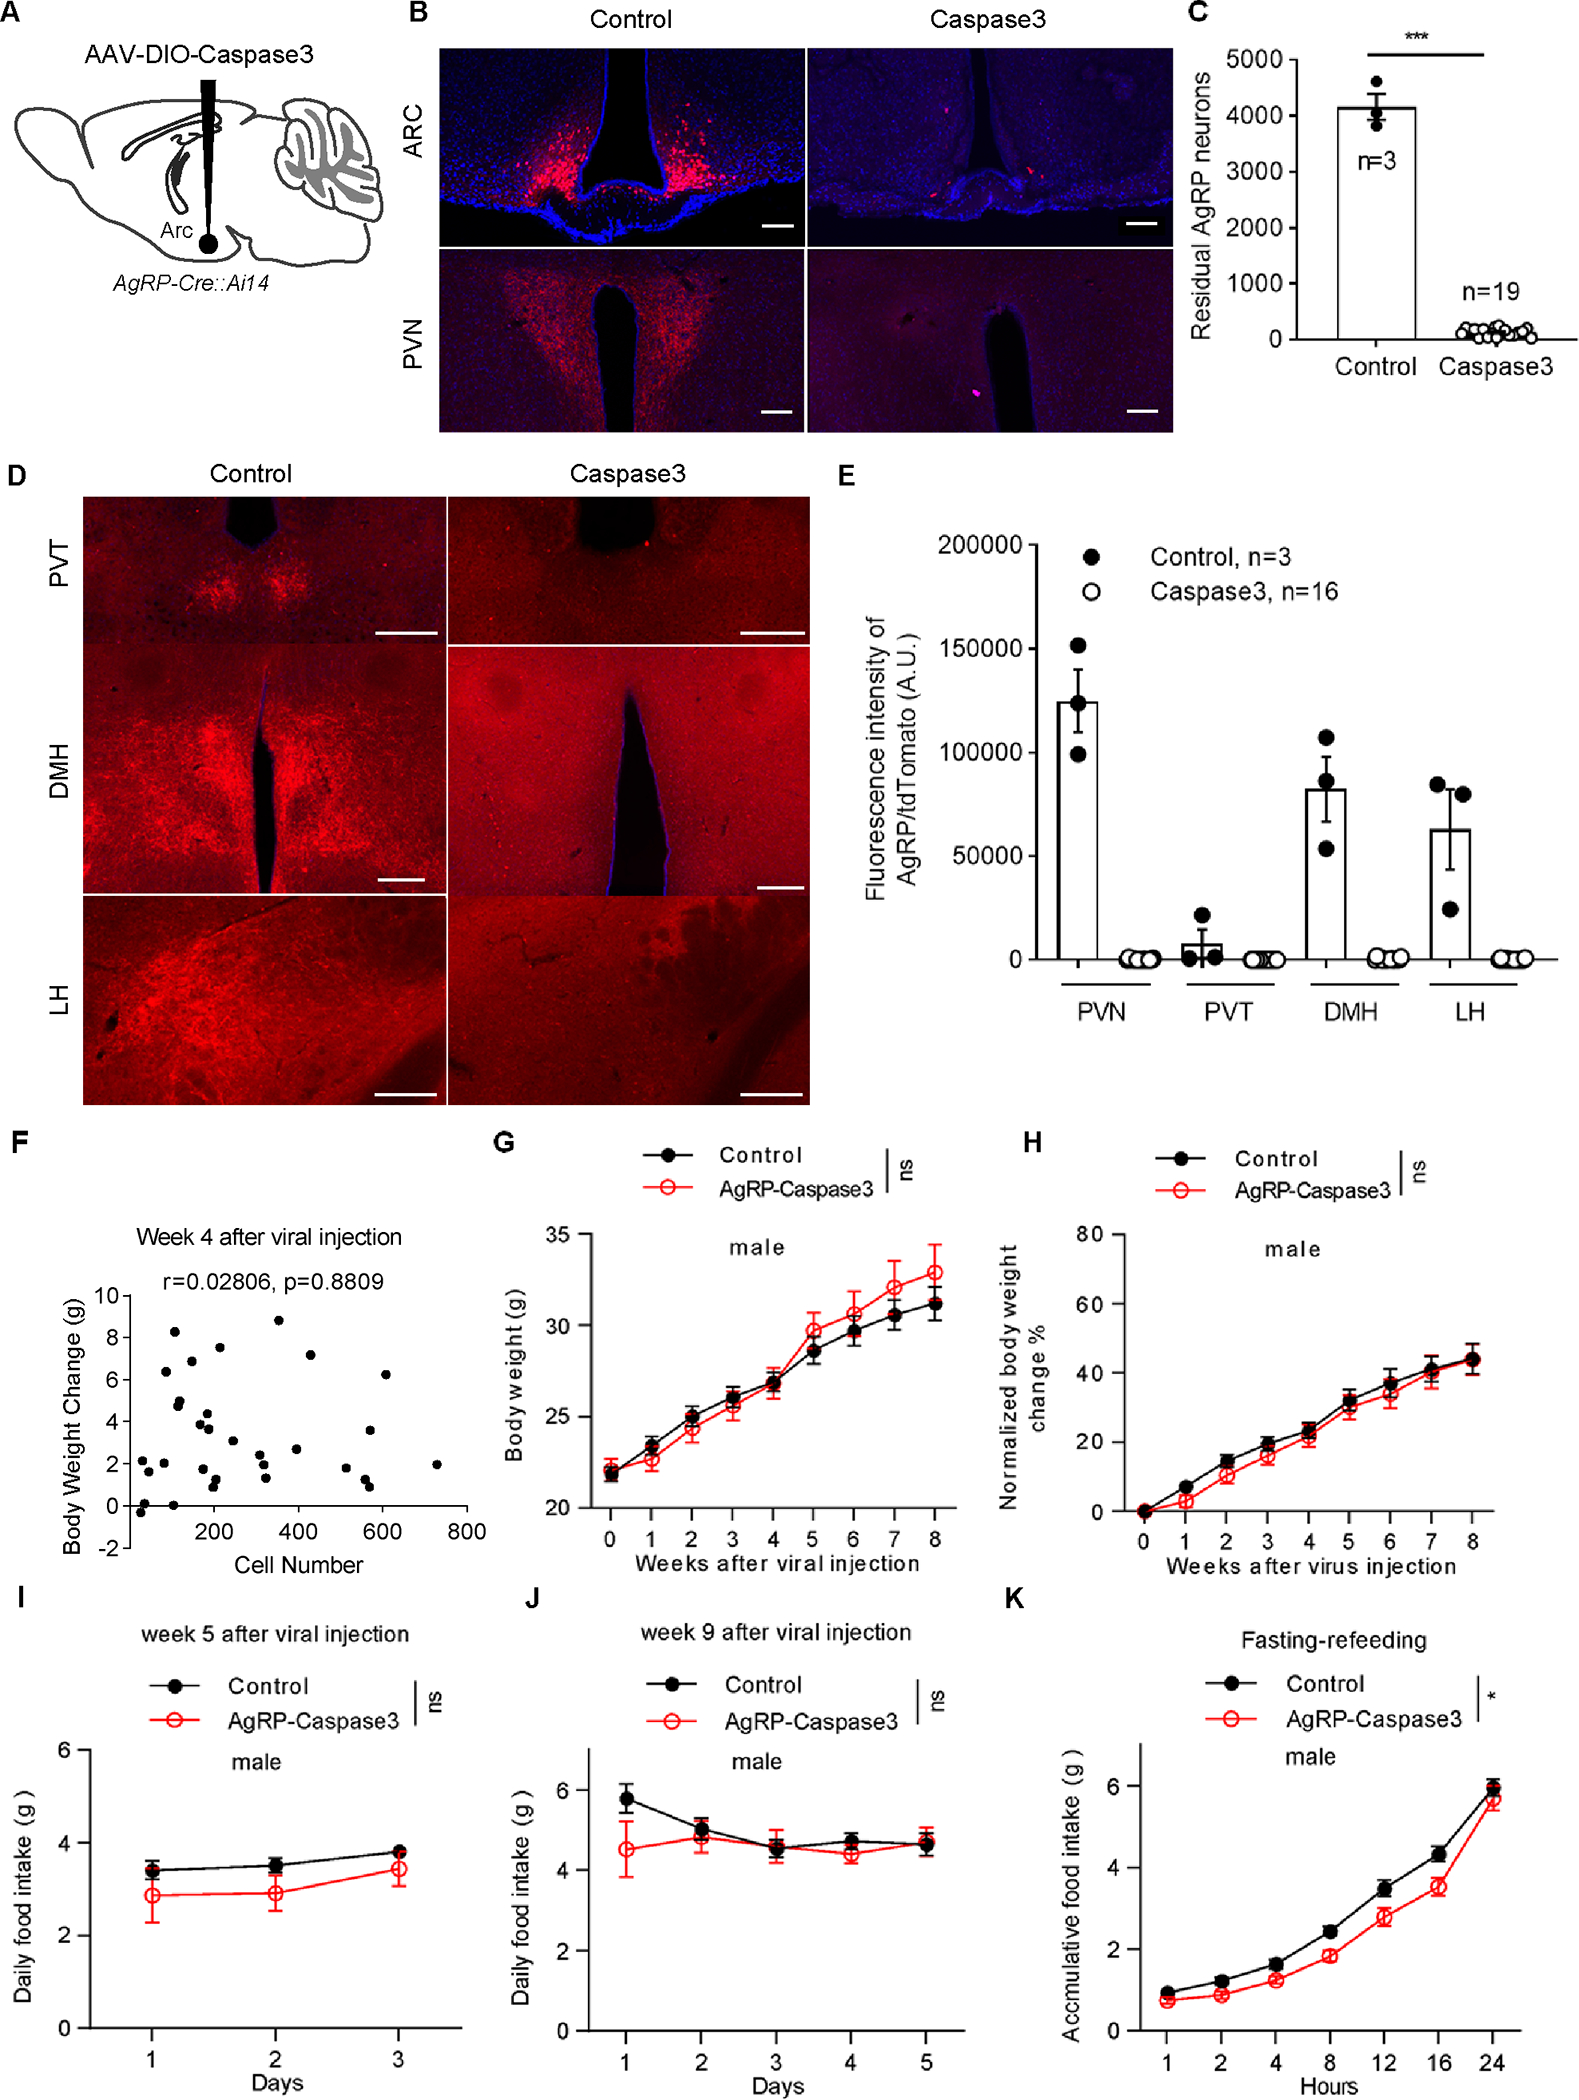
Figure 3. Caspase 3-mediated lesion of AgRP neurons in the ARC fails to reduce body weight or food intake in male adult mice.

A, Schematic of the virus injection into the ARC of AgRP-Cre::Ai14 mice. B, Ai14 reporter expression (red) and DAPI staining (blue) in mice that received sham (left panels) and AAV-flex-taCasp3-TEVp viral injections (right panels) to bilateral ARC in both ARC (top panels) and one of the major projection sites PVN (bottom panels). Scale bars: 200 μm. C, Comparison of the total numbers of Ai14 reporter-positive neurons in the ARC between the control and AAV-flex-taCasp3-TEVp injection groups. Unpaired Student’s t test. ***p< 0.001. D, E, AgRP/tdTomato terminal signals in projection areas of AgRP neurons. Representative pictures (D) and qualitative results (E). Scale bars: 200 μm. F, The correlation between the number of remaining AgRP neurons and body weight gain at week 4 after viral injection. Each symbol represents an individual mouse. n=31 mice of both sexes. G, H, Comparison of weekly absolute body weight (G) and normalized body weight change (H) between the control mice (n=7 or 15 male mice at different time points) and AAV-flex-taCasp3-TEVp injection groups (n=4 or 11 male mice at different time points) during the 8 weeks after viral delivery. Two-way ANOVA followed by Bonferroni’s multiple comparisons, p = 0.9471 in G, p = 0.4250 in H. ns, not significant. I, J, Daily food intake between the control (n=7 male mice) and AAV-flex-taCasp3-TEVp injection groups (n=6 or 4 male mice) over 3–5 consecutive days at weeks 5 (I) and 9 (J) after viral delivery. Two-way ANOVA followed by Bonferroni’s multiple comparisons, p = 0.2025 in I, p = 0.4476 in J. ns, not significant. K, Fasting-refeeding curve measured at week 9 after viral injections. Two-way repeated ANOVA followed by Bonferroni’s multiple comparisons in control (n=15 mice) and AgRP-ablated mice (n=11), p = 0.0176. *p< 0.05. All data represent the mean ± SEM.
See also Figures S5.
