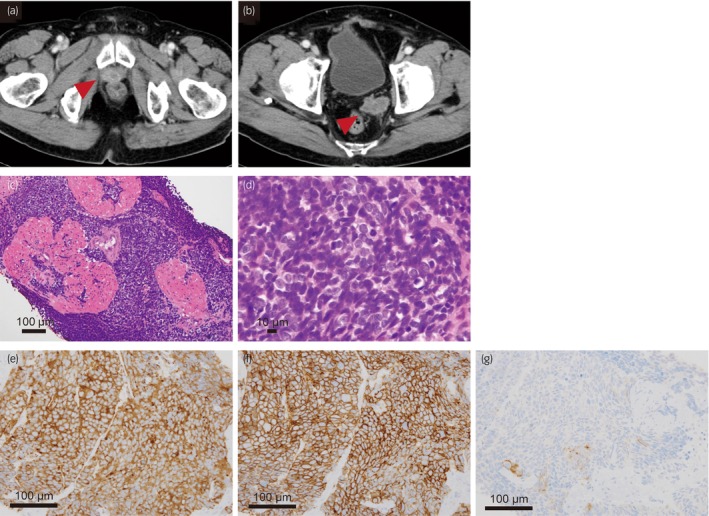
Fig. 1.

Computed tomography image when the patient was diagnosed with t‐NEPC (a, b) and microscopic findings of the tumor (c–g). (c) Small, clustered cells with a high nuclear‐to‐cytoplasmic ratio and no glandular pattern are observed (hematoxylin and eosin staining: ×20). (d) There are frequent mitotic figures (hematoxylin and eosin staining: ×100). (e) The tumor cells are positive for synaptophysin, (f) CD56, and (g) chromogranin A, partially (×200).
