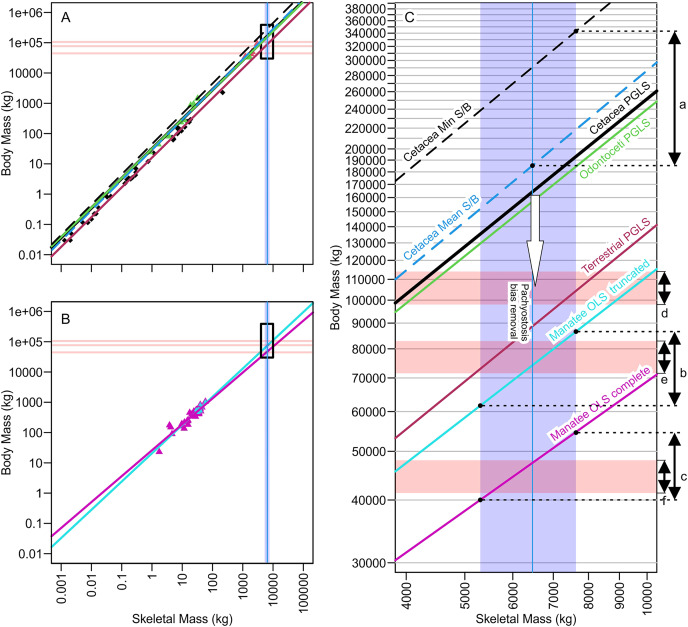
Figure 3. Regression lines for body mass against skeletal mass based on different subsets of the data analyzed, illuminating how minor differences in regression coefficients or assumption leads to substantial body mass differences of more than 100 tons.
(A) Phylogenetic generalized least square regression of body mass against skeletal mass based on the data from Bianucci et al. (2023). (B) Ordinary least square regression of body mass against skeletal mass based on manatee data. (C) Same as A and B combined but zooming into the black rectangle, which is the part relevant to Perucetus colossus. Red horizontal rectangle extending from the y axis represents the volumetric estimates of body mass at a fork length of 20 m (above), 18 m (middle), and 15 m (below), based on the body outline reconstruction of Bianucci et al. (2023). Blue vertical band from the x axis denotes the range of skeletal mass estimated for Perucetus by Bianucci et al. (2023), with a solid line inside being the mean estimate. Double-headed arrows on the right are body mass ranges suggested by: a, based on skeletal mass assuming isometry, as in Bianucci et al. (2023); b, based on regression from 11 individuals of manatee used by Bianucci et al. (2023); c, based on regression from 38 individuals of manatee in the original data of Domning & de Buffrénil (1991); d, the body outline reconstruction by Bianucci et al. (2023) at a fork length of 20 m; e, the same at a fork length of 18 m; and f, the same at a fork length of 15 m. See Tables 1 and 2 for the values. S/B refers to Skeletal mass/Body mass ratio. White arrow indicates the direction toward the unknown regression line for pachyostotic whales.

