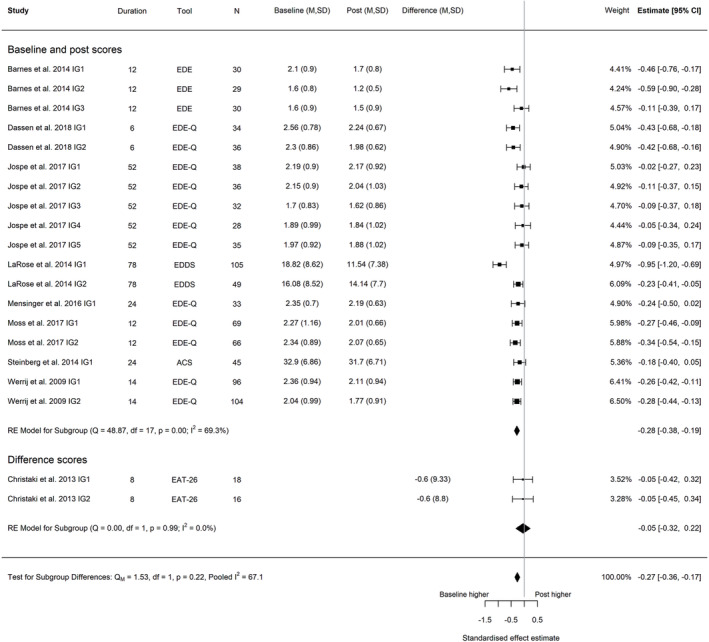
FIGURE 2.

Forest plot of the change in global eating disorder scores between baseline and post‐intervention following behavioral weight management in adults with overweight and obesity. Each estimate was standardized using Hedges' g. A correlation of 0.7 was assumed between time points when necessary for the calculation of Hedges' g. A random effects model was used to combine estimates from each trial. Abbreviations: ACS, Anorectic Cognition Scale; EAT, Eating Attitudes Test; EDE‐Q, Eating Disorder Examination Questionnaire; EDE, Eating Disorder Examination, IG, intervention group.
