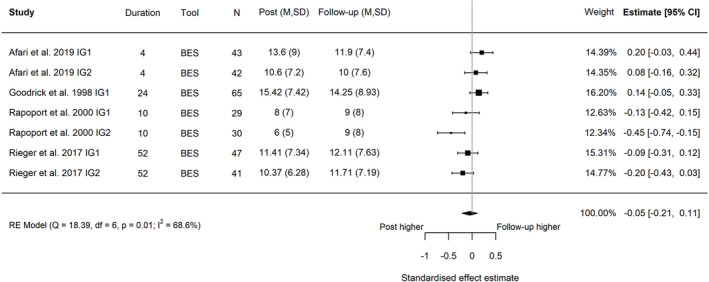
FIGURE 6.

Forest plot of the change in binge eating between post‐intervention and follow‐up following behavioral weight management in adults with overweight and obesity. Each estimate was standardized using Hedges' g. A correlation of 0.7 was assumed between time points when necessary for the calculation of Hedges' g. A random effects model was used to combine estimates from each trial. Abbreviations: BES, Binge Eating Scale, IG, intervention group.
