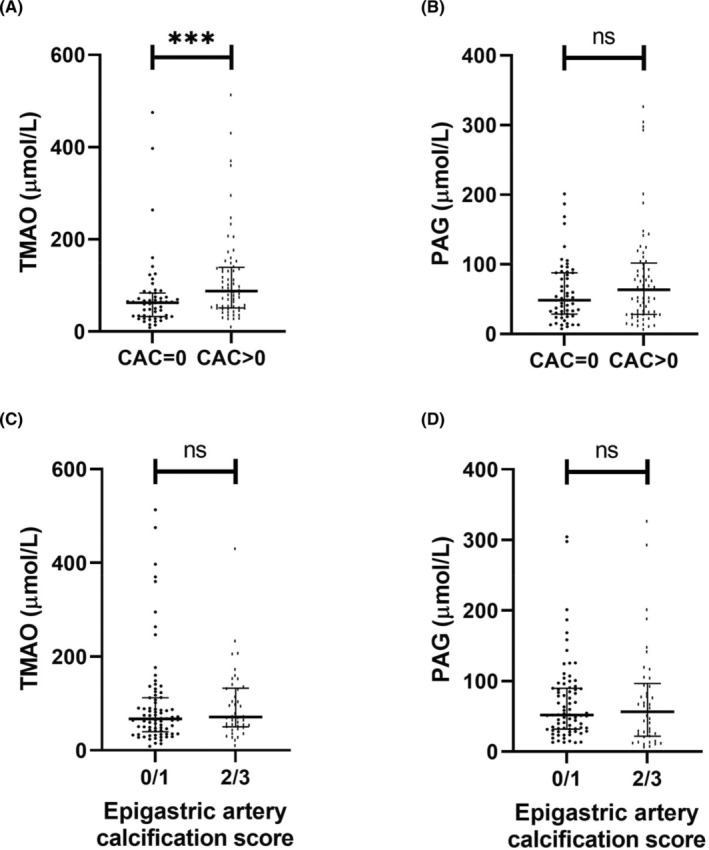
FIGURE 2.

Comparisons between TMAO and PAG versus coronary artery calcification or epigastric artery calcification in a living‐donor kidney transplantation patient cohort (n = 120). (A) Serum TMAO concentration in study population stratified by presence of CAC. (B) Serum PAG concentration in study population stratified by presence of CAC. For (A and B), CAC score was quantified in Agatston units using non‐contrast multi‐detector cardiac CT scan. n = 55 and n = 65 for CAC = 0 and CAC >0 groups, respectively. (C) Serum TMAO concentration in relation with epigastric artery calcification score. (D) Serum PAG concentration in relation with epigastric artery calcification score. For (C and D), epigastric arteries were obtained at living‐donor kidney transplantation and scored for calcification by a trained pathologist on tissue sections 1–2 μm thick. Vessels were stained with von Kossa (silver nitrate plus nuclear fast red) and the extent of medial calcification was graded from 0 (no calcification) to 3 (severely calcified). Groups were formed based on the degree of calcification, that is, 0/1 corresponds to non‐calcified and mildly calcified vessels (n = 78), and 2/3 corresponds to moderately and severely calcified vessels (n = 42). Data are presented as mean ± standard error of mean. Differences between groups were assessed by non‐parametric Mann–Whitney U test. ***p < .001. CAC, coronary artery calcium; PAG, phenylacetylglutamine; TMAO, trimethylamine N‐oxide.
