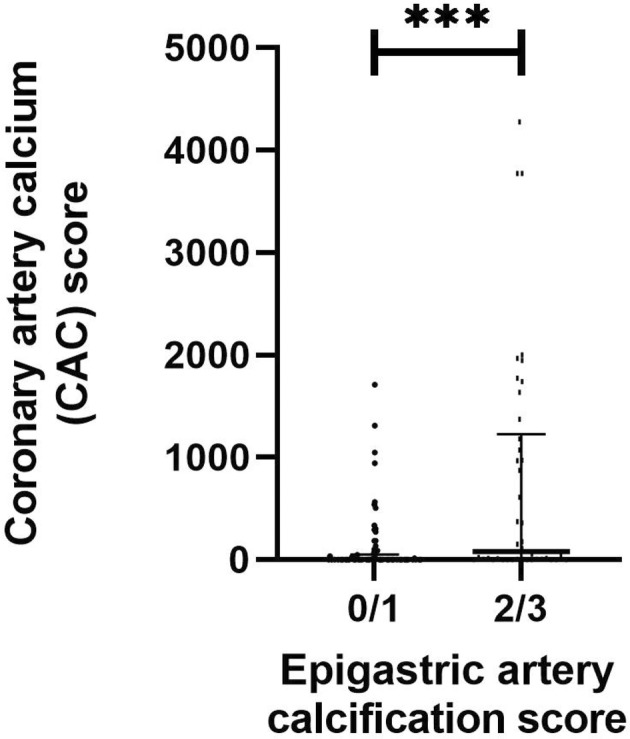
FIGURE 4.

Comparisons between CAC score and epigastric artery calcification in the living‐donor kidney transplantation patient cohort (n = 120). CAC score was quantified in Agatston units using non‐contrast multi‐detector cardiac CT scan. Epigastric arteries were obtained at living‐donor kidney transplantation and scored for calcification by a trained pathologist on tissue sections 1–2 μm thick. Vessels were stained with von Kossa (silver nitrate plus nuclear fast red) before the extent of medial calcification was graded from 0 (no calcification) to 3 (severely calcified). Groups were formed based on degree of calcification, that is, 0/1 (n = 78) corresponds to non‐calcified and mildly calcified vessels, and 2/3 (n = 42) corresponds to moderately and severely calcified vessels. Data are presented as mean ± standard error of mean. Differences between groups were assessed by non‐parametric Mann–Whitney U test. ***p < .001.
