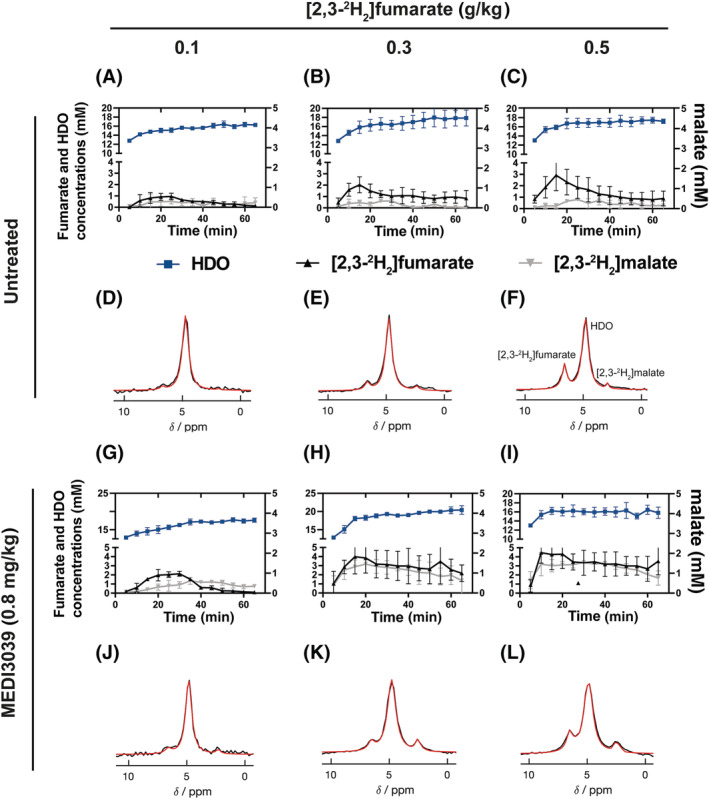
FIGURE 1.

2H MR spectroscopic measurements of labeled fumarate, malate and water concentrations in MDA‐MB‐231 tumors following injection of increasing concentrations of [2,3‐2H2]fumarate (A–C,G–I) before (A–C) (n = 3) and 24 h after treatment with 0.8 mg/kg MEDI3039 (G–I) (n = 3). The corresponding representative spectra, the sum of 12 spectra recorded over 60 min, are shown in (D–F) and (J–L). [2,3‐2H2]fumarate was infused at three different concentrations, ranging from 0.1 (n = 3) (A,D,G,J), 0.3 (n = 3) (B,E,H,K) and 0.5 g/kg (n = 3) (C,F,I,L), and started 5 min following the start of acquisition of the first spectrum.
