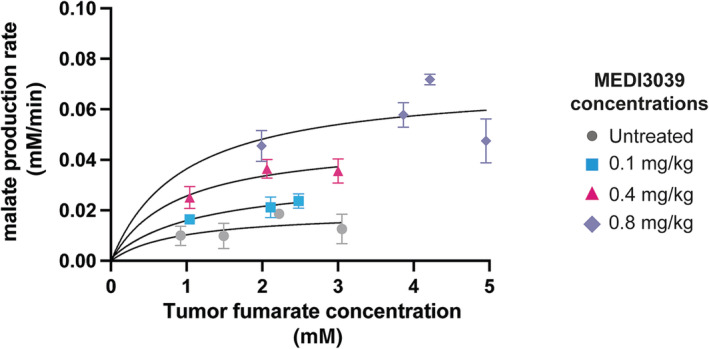
FIGURE 2.

Apparent Km of fumarase for tumor fumarate. Apparent malate production rates were calculated between 0 and 20 min following fumarate administration and plotted against the tumor fumarate concentration at 20 min. The curves were fit to the Michaelis–Menten equation to obtain an estimate of Km and Vmax. The three datapoints at tumor fumarate concentrations between 4 and 5 mM were obtained following injection of 1 g/kg [2,3‐2H2]fumarate and were taken from reference. 8
