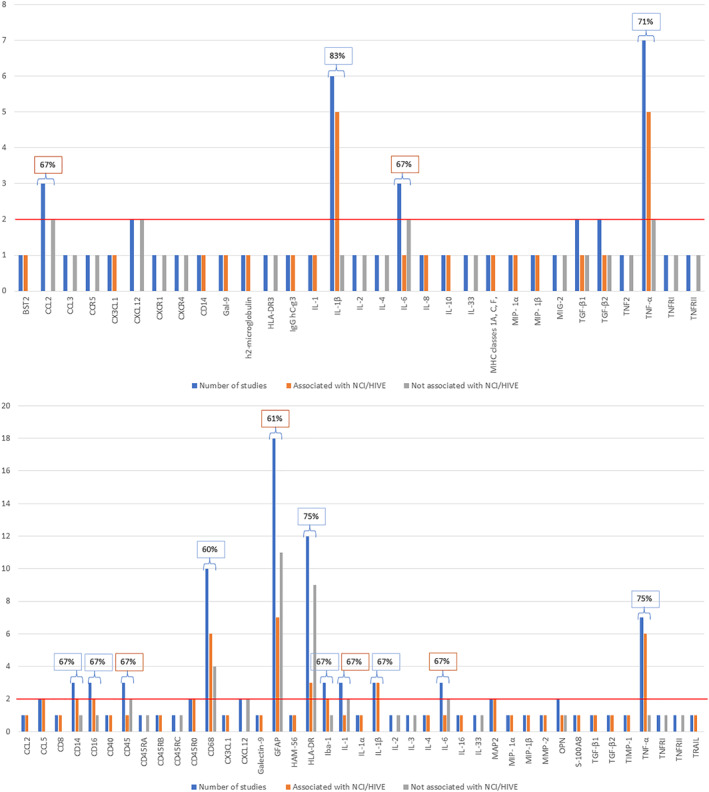
FIGURE 2.

(a and b): The frequency of marker investigation across all studies. The blue bars indicate the number of studies which investigated a particular marker. Markers were considered noteworthy when at >2 independent studies investigated the marker: criteria one (red line cut‐off). The orange bars indicate the number of studies which reported significant associations of a particular marker with NCI/HIVE in PLWH. The grey bars indicate the number of studies which reported no significant associations of a particular marker with NCI/HIVE in PLWH. The percentage indicates the number of studies which report a relationship between a particular marker with NCI/HIVE in PLWH (orange or grey) in relation to the number of studies that investigated the marker (blue). The percentage >50% was indicated in boxes, with blue boxes indicating the association with NCI/HIVE, whereas orange boxes indicate no association with NCI/HIVE (criteria 2). (a) Gene expression markers and (b) Protein expression markers.
