FIGURE 4.

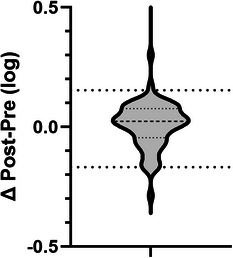
Intra‐batch protein abundance differences of external standard (post‐batch versus pre‐batch) for top 100 proteins in 65 batches. Major dash – median, minor dashes 25% and 75%. Major dots – 5% and 95%.

Intra‐batch protein abundance differences of external standard (post‐batch versus pre‐batch) for top 100 proteins in 65 batches. Major dash – median, minor dashes 25% and 75%. Major dots – 5% and 95%.