
FIGURE 1.
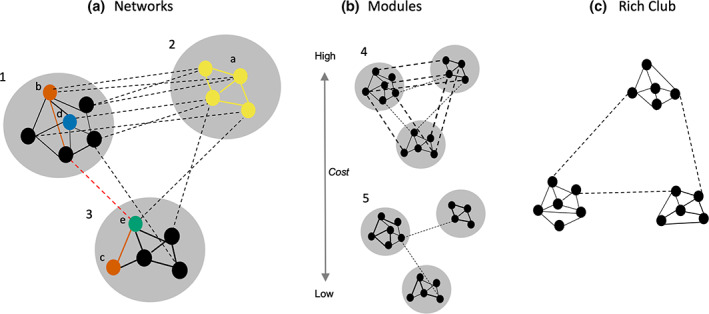
Illustration of functional networks and small‐world metrics. (a) Larger gray circles are networks of the graph (networks 1, 2 and 3). The dots within each of the networks are nodes and the lines are the edges (significant correlation between nodes in resting‐state networks); solid lines are within‐network edges and dashed lines between‐network edges. Yellow nodes and edges depict a network displaying within‐network connectivity. Connectivity strength of node a is the average weight of the edges linking with it; and local efficiency is the inverse of the average shortest path length of each node to its neighbors. Red edges depict the shortest path between the red node b and red node c. the shorter the average path length across all pairs of nodes, the higher the global efficiency. The blue node d depicts a provincial hub (strongly connects nodes within the same network); the green node e depicts a connector hub (connects nodes between different networks). (b) Modules reflect the division of larger networks into smaller “building blocks” or communities, typically reflecting anatomically connected or functionally related regions. The human brain displays “small world” properties that balances an economical trade‐off between efficiency, physical connection cost and maximizing topological value. In module 4, the networks are wired for global efficiency and integrative processing, with each node likely to connect to multiple other nodes within‐ and between‐networks, minimizing path length and optimizing global efficiency. However, this topology comes at a high wiring cost owing to the large number of connections across the system, particularly long‐range connections. In comparison, in module 5, the networks are wired to minimize cost and support functional specialization, with each node having within‐network near neighbors topologically and spatially. However, insufficient topologically direct connections or edges between networks limits global integration and efficiency. Efficiency is reduced through information needing to transverse a high number of long‐range paths or edges between nodes in different networks. Relative to module 4, module 5 is also higher in segregation (stronger or denser links within‐networks but weaker or sparser links between‐networks) and modularity (higher proportion of within‐network connections, or higher average path length, across the system). (c) Rich club network is indicated by functional connections between dense networks (Adapted from Cohen & D'Esposito, 2016; Wig, 2017).