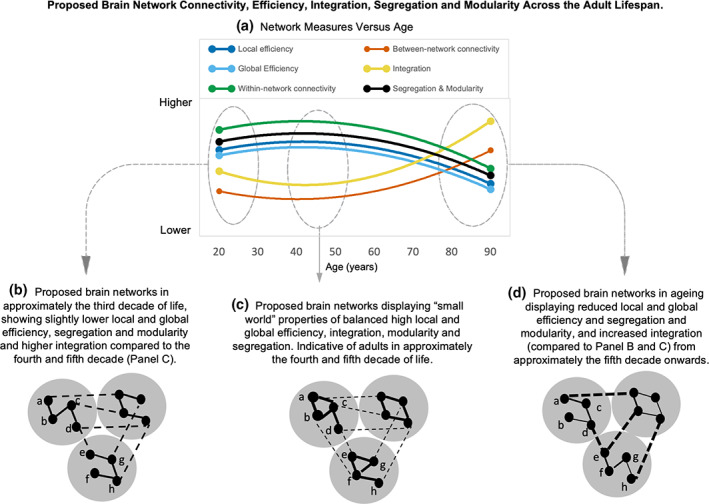
FIGURE 5.

Proposed brain network differences across the adult lifespan. Panel a shows network measures from Figure 3a across the adult lifespan. All measures had “high” certainty of age effects from the GRADE assessment, except for global efficiency, which was rated as “moderate”. Panel c illustrates how the human brain sits between the extremes of module 4 and module 5 in Figure 1b, and displays “small world” properties, peaking in the fourth or fifth decade with local efficiency complemented by global efficiency. Local, short‐distance connections reflect the capacity for information transfer between nodes across a short path length and are complemented by sparse long‐distance connections that incur a higher wiring cost. Topologically direct connections between spatially remote brain regions are expected to yield benefits in terms of flexible function and behavior. The system balances modularity, integration, and segregation by balancing strength or density of within‐ and between‐network connections and relatively short average path lengths. As shown in panel b, brain networks in approximately the third decade of life show somewhat lower local and global efficiency and integration compared to the fourth and fifth decade (panel c). Panel d, compared with younger adults (panel b and c), older adults display reduced local efficiency (increased path length to neighboring nodes) and global efficiency (loss of long‐range paths or longer average path lengths) between nodes across networks. For example, in panel c, local efficiency is seen in the direct path from node a to node b traversing one edge only; whereas in panel d the path from node a to node b traverses three edges (node a to c to d to b). In terms of global efficiency, in panel c, the path length from node a to node h is via three edges: Node a to b to f to h; whereas in panel d, it is via six edges: Node a to c to d to e to f to g to h. within‐network connectivity strength is also reduced in older adults in panel d compared to younger adults in panel b and c (indicated by thinner black lines in panel d within networks) and between‐network connectivity increased (indicated by thicker black lines across networks in panel d compared to panel b and c), leading to a less segregated and more modular, integrated system. (Adapted from Bullmore & Sporns, 2012).
