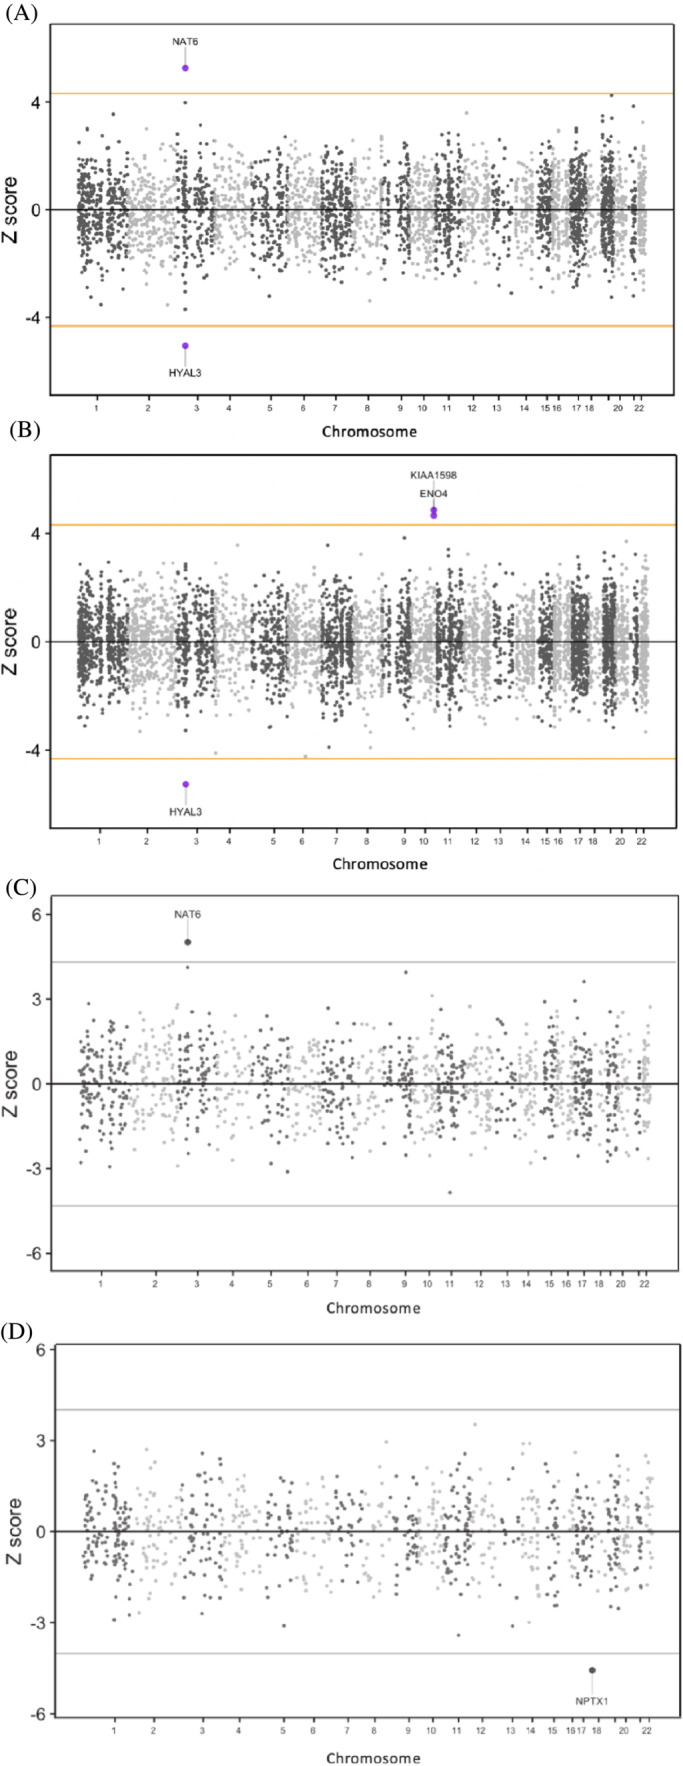
FIGURE 1.

Miami plot of cannabis use disorder (CUD) transcriptome‐wide association (TWA) analysis of brain cerebral cortex (A) and whole blood (B) and proteome‐wide association (PWA) analysis of brain (C) and whole blood (D). The orange horizontal lines are the significance threshold after Bonferroni correction for the total number of imputated models of expression (alpha/n).
