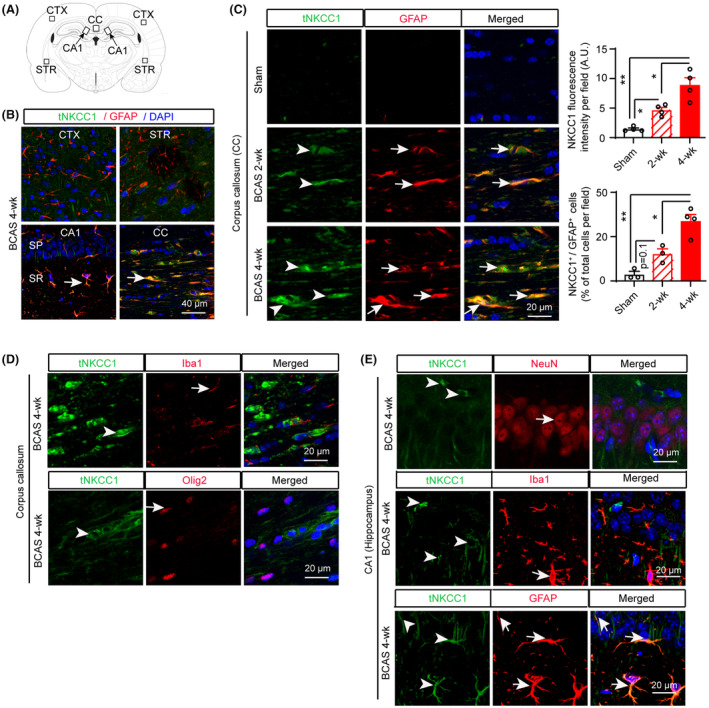
FIGURE 2.

Total NKCC1 protein expression in mouse brains after BCAS. (A) Brain section illustrates sample collection in the cortex (CTX), corpus callosum (CC), hippocampal CA1 subfield (stratum pyramidale [SP] and stratum radiatum [SR]), and striatum (STR) areas. (B) Compared to CTX, STR, and CA1 regions, a robust increase in tNKCC1 protein expression in GFAP+ astrocytes (arrow) was detected in the CC at 4 weeks after BCAS surgery. (C) Time‐dependent tNKCC1 protein expression (arrowhead) in GFAP+ astrocytes (arrow) at 2 weeks and 4 weeks after BCAS. Data are mean ± SEM; one‐way ANOVA, Tukey's post hoc test; n = 4, *p < 0.05, **p < 0.01. (D) In the CC, the increase in tNKCC1 protein expression (arrowhead) does not colocalize with Iba+ microglia/macrophages (arrow) or Olig2+ oligodendrocytes at 4 weeks after BCAS. (E) In the hippocampal CA1, an increase in tNKCC1 protein expression (arrowhead) does not colocalize with NeuN+ neurons (arrow) or Iba1+ microglia/ macrophages (arrow) but colocalizes with GFAP+ astrocytes (arrow) at 4 weeks after BCAS.
