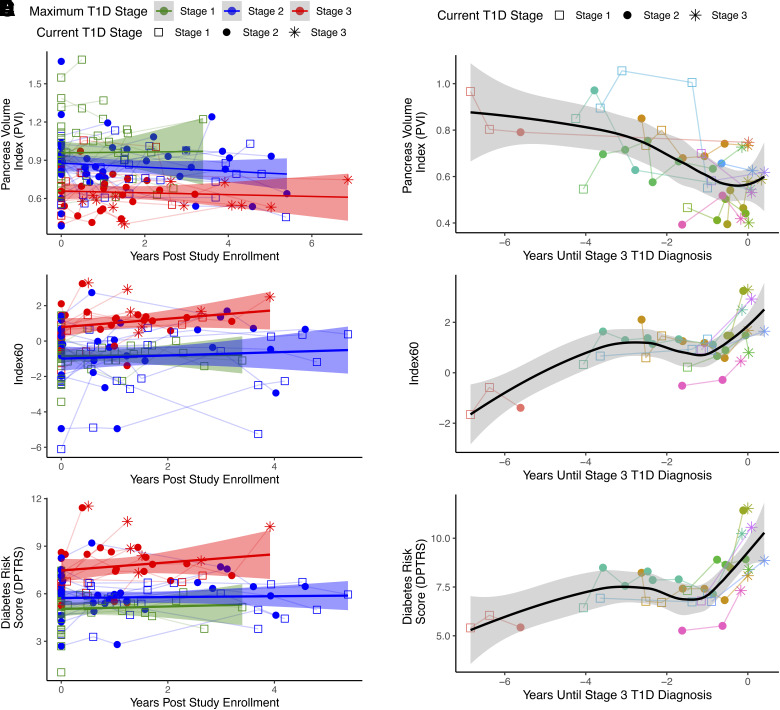
Figure 3.
A, C, and E: Longitudinal plots of PVI (A), Index60 (C), and DPTRS (E) for all study participants over the time course of study enrollment. Current T1D stage at MRI is indicated by marker shape. Highest T1D stage reached by study participant is indicated by color. Some individuals did not receive MRI or OGTT after experiencing progression to stage 3 T1D. Red indicates participants who experienced progression to stage 3 T1D, whereas green (stage 1) and blue (stage 2) indicate participants who did not experience progression to symptomatic disease. Weighted line displays cohort average, and shaded area displays 95% CI. B, D, and F: Longitudinal plots of PVI (B), Index60 (D), and DPTRS (F) versus time to diagnosis for the 11 study participants who experienced progression to stage 3 T1D. Individual participants are color coded, and T1D stage at MRI is indicated by marker shape. PVI declined over time, whereas Index60 and DPTRS increased proximally to diagnosis in individuals diagnosed with stage 3 T1D.

