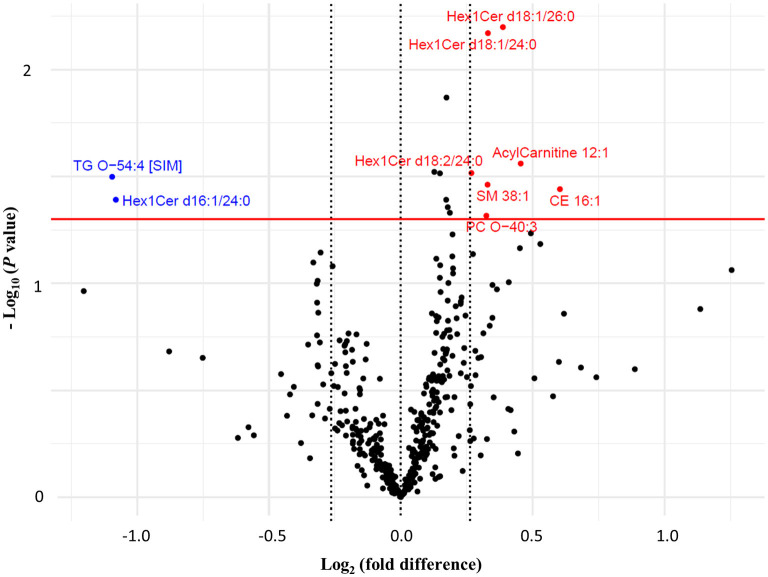
Figure 3.
Volcano plot comparing the fold changes of individual lipid species between the wolfberry group and control group. Species with higher fold change value in wolfberry group (in red) and control group (in blue) defined based on Welch's independent t-tests (P < 0.05) with a minimum 0.2-fold difference. CE, cholesterol ester; Hex1Cer, monohexosylceramide; ns, no significant difference; PC, phosphatidylcholine; PC-O, ether-phosphatidylcholine; PC-P, plasmalogen-phosphatidylcholine; SM, sphingomyelin; TG, triglyceride; TG-O, ether-triglyceride.

