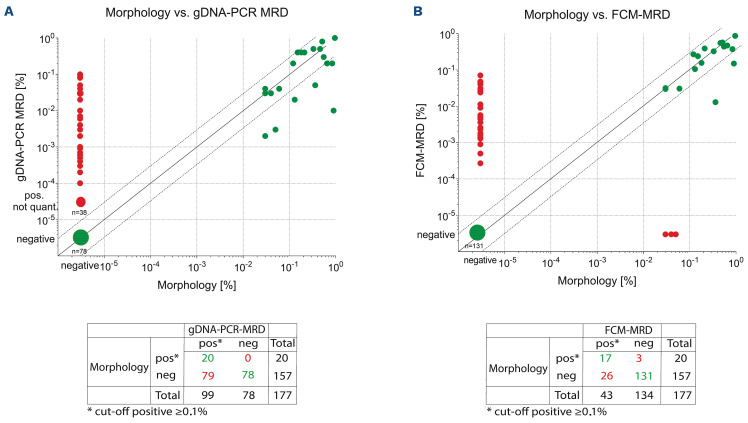
Figure 5.
Concordance of gDNA-PCR MRD and FCM-MRD with conventional morphological assessment. Each symbol represents one MRD estimate. Values that are MRD-positive or MRD-negative using both methodologies are considered concordant (green dots), whereas discordant samples are negative with one methodology but positive with another (red dots). In addition, dashed lines above/below the x=y line mark the range of variance according to Dworzak et al.,35 i.e. between 3x larger or smaller till 1/3 of the x=y value. Statistics performed using GraphPad Prism. gDNA: genomic DNA; PCR: polymerase chain reaction; MRD: measurable residual disease; FCM: flow cytometry.

