
FIGURE 3.
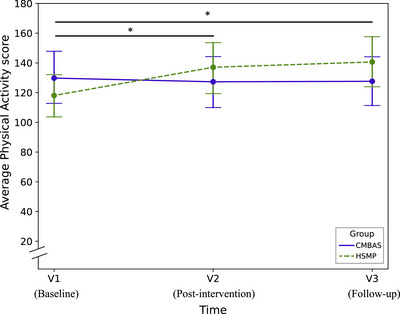
This data‐based plot shows the evolution of average physical activity scores from baseline (V1) to post‐intervention (V2) and follow‐up (V3) for each intervention condition. The y axis represents the mean score on the PASE questionnaire from 20 to 200 to allow for a better visualization (maximum range: from 0 to 793, observed range in SCD‐Well: 117 to 141. V1, baseline visit; V2, post‐intervention visit after 8 weeks; V3, follow‐up visit 24 weeks post‐intervention. Asterisks correspond to between‐group significance. * P < 0.05. CMBAS, caring mindfulness‐based approach for seniors; HSMP, health self‐management program; PASE, Physical Activity Scale for the Elderly.