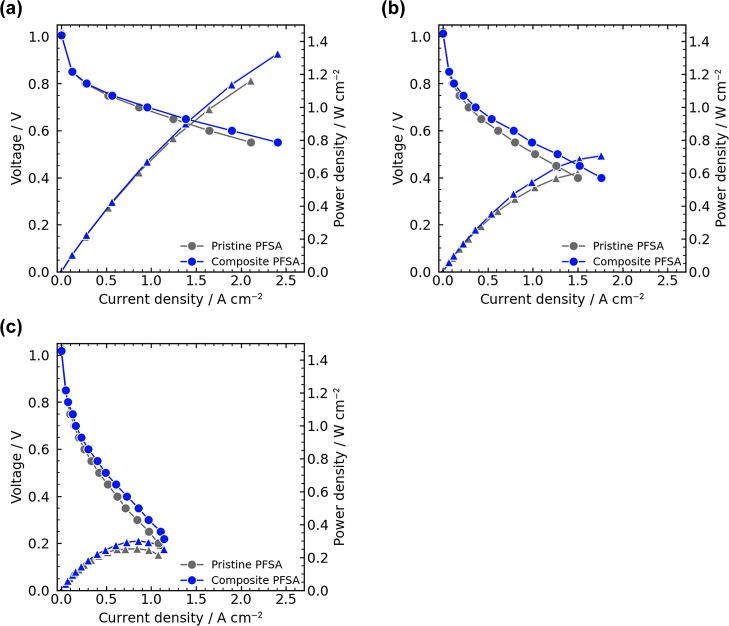
Figure 6.
Polarization curves of fuel cells using pristine and composite PFSA membranes (thin fiber content of 15 wt %) at (a) 80 °C (100% RH@anode and 81% RH@cathode), (b) 100 °C (47% RH@anode and 38% RH@cathode), and (c) 120 °C (24% RH@anode and 19% RH@cathode). Circle and triangle represent voltage and power density, respectively.

