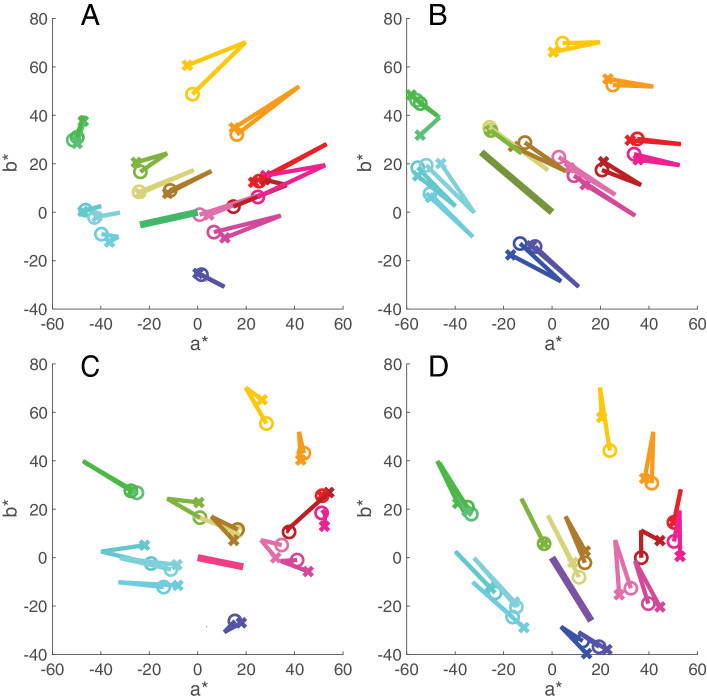
Figure 12.
Diagrams showing in CIE a*b* plane the direction and magnitude of the four illuminant shifts (A, greenish; B, yellowish; C, reddish; D, bluish) with a heavy line that starts at the chromaticity of neutral daylight and ends at the chromaticity of the test illumination. As in Figure 11, the lines for each object start at the chromaticity of their memory match under neutral daylight and extend to their memory match under the new illuminant, represented by crosses. The line ending in a circle represents the chromaticity shift of the memory selection for a given object from neutral daylight to the test illuminant. Plots are averages over two sessions. Changes in the lightness plane are not shown here.

