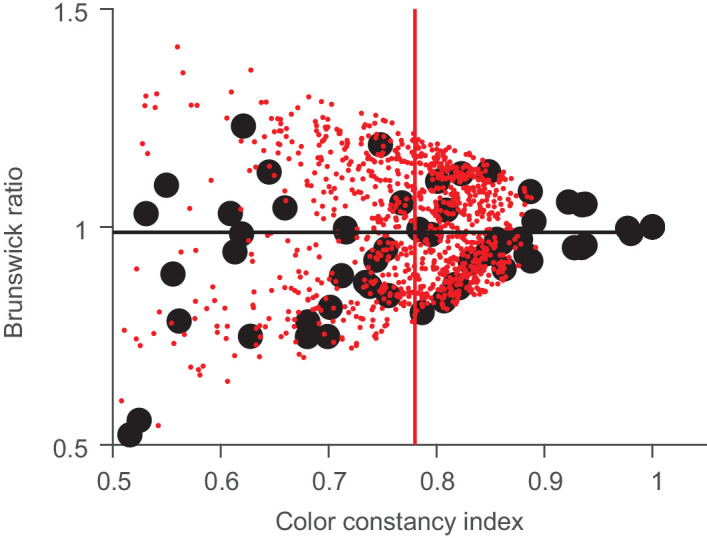
Figure 16.

Relationship between BR and CCI. The black points are our data, and the small red points are simulations based on the color shifts from our study (23.84 ± 7.6 ∆E) and a noise error of 5.13 ∆E units. Note that the black circle at (1, 1) represents five data points that are completely overlapping. The black line represents the average BR, and the red line represents the average CCI for the simulated data.
