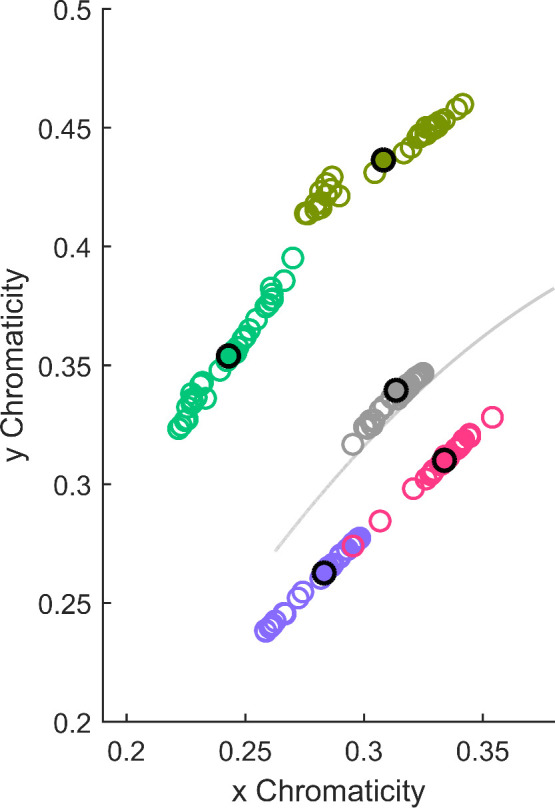
Figure 4.

Judd–Vos-corrected CIE x,y chromaticities of the five illuminants measured in each session. Each colored circle represents the average of measurements before and after each session. The solid disk with a black outline represents the chromaticity of one illuminant averaged over all measurements. The solid gray line represents the daylight locus.
