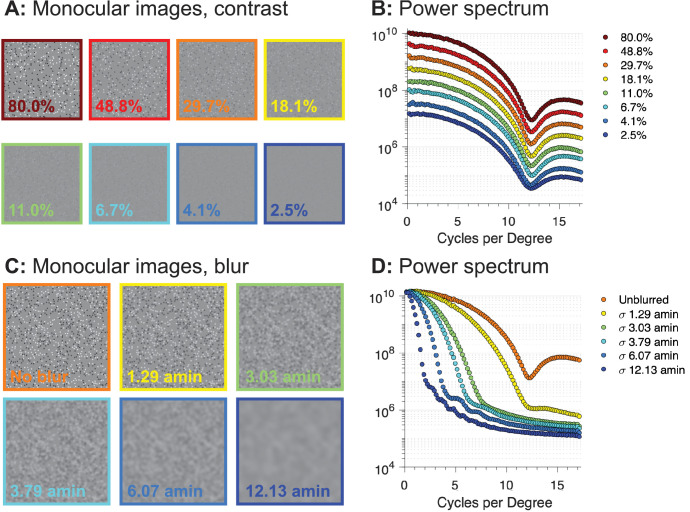
Figure 2.
Example half-images for contrast variation (top left) and blur variation (bottom left) with corresponding Fourier power spectra. Contrast in the example images is specified on the Michelson definition. The blur levels are specified in terms of the standard deviation of the Gaussian kernel in terms of visual angle (arcmin). Contrast reduction affects all spatial frequencies while blur manipulation preferentially affects high spatial frequencies.

