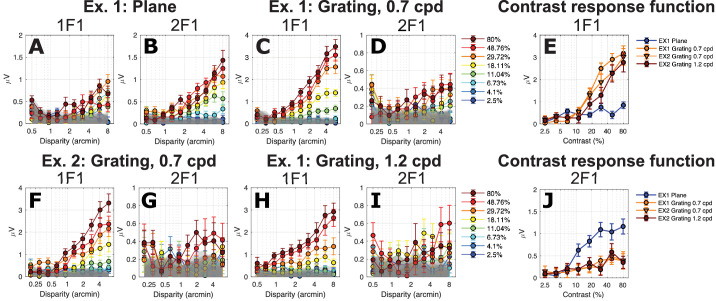
Figure 4.
Disparity response functions for plane (A, B) and grating (C, D, F–I) stimuli as a function of contrast (legend) for 1F1 and 2F1. (E) Contrast response function derived from responses measured at 6 arcmin of disparity at 1F1. (J) As in E, but for the 2F1 response component. Data are show over both experiments 1 (Ex. 1) and 2 (Ex. 2).

