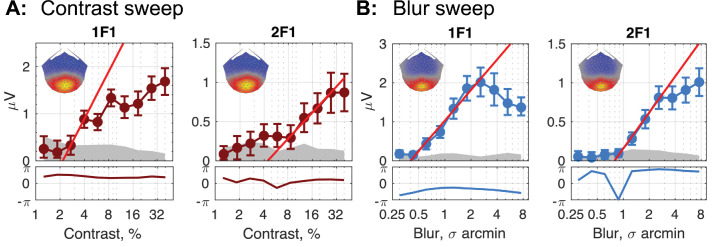
Figure 8.
Top panels: Response functions for RC1 (spatial map insert in each figure) for the first two harmonics of the neural response to a stimulus increasing in contrast (A) or blur (B). Linear fits (bright red line in all plots) reveal the smallest amount of contrast or blur required to elicit a differential response between a given level of contrast or blur and an unmanipulated image (100% contrast or 0 blur). Generally, this threshold value is smaller for the 1F1 than for the 2F1 response. The lower panels plot the response phase with respect to the 2-Hz stimulus. Phase lag is in the upward direction.

