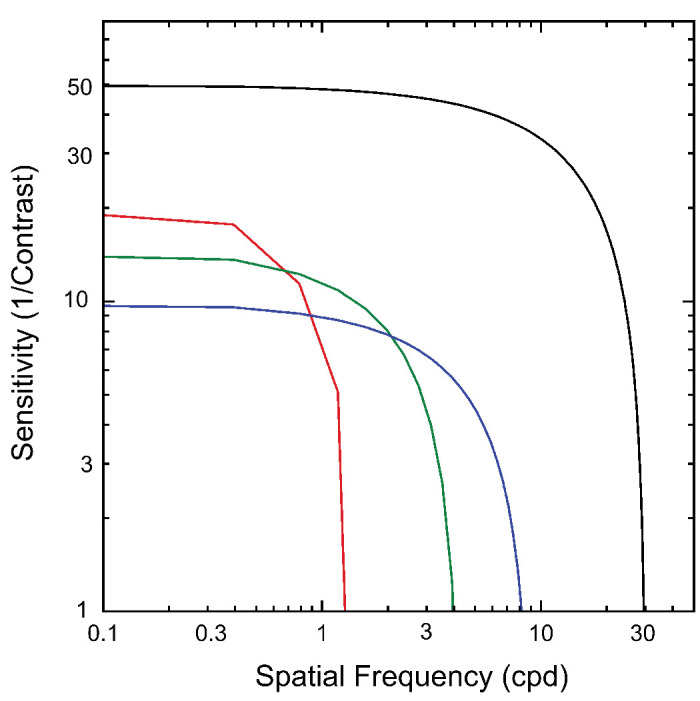
Figure 9.

Summary inferred contrast sensitivity functions (CSFs) for different response components. Black curve: CSF for the monocular half-images derived from experiment 5, 1F1. Red curve: CSF for the 2F1 responses to disparity modulation of a plane. Contrast sensitivity is lower than for the half-images but higher than those for the grating responses. The high spatial frequency limit is the lowest measured. Green: CSF for the 0.5/0.7-cpd disparity gratings. Peak contrast sensitivity is intermediate between the plane and 1.2-cpd gratings, as is its spatial resolution. Blue: The CSF for the 1.2-cpd disparity grating has the lowest peak sensitivity but the highest resolution of the three disparity-dependent CSFs.
