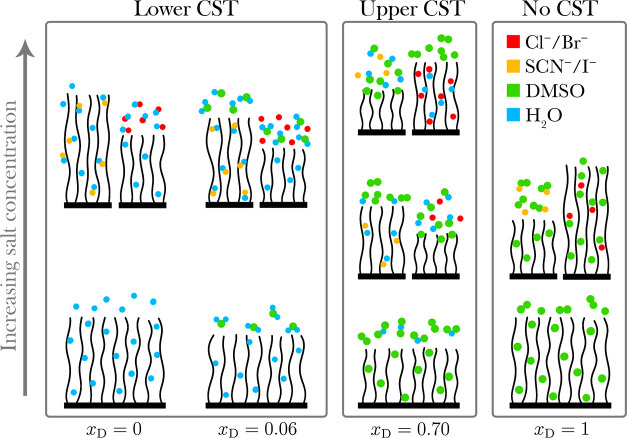
Figure 10.
Schematic diagram of a polymer brush in DMSO–water electrolytes as presented herein. Contour lengths across all brushes are invariant; swelling and collapse behavior only are shown. Increasing DMSO mole fraction (xD) within the solvent composition is represented on the horizontal axis (xD = 0, 0.06, 0.70, and 1) and increasing salt concentration is represented on the vertical axis (0, 0.2, and 0.9 mol %). A forward series is noted for the polymer brush in water-rich electrolytes and in 0.2 mol % electrolytes of xD = 0.70. Concentration-induced series reversal is noted in xD = 0.70 electrolytes from 0.2 to 0.9 mol %. Solvent-induced series reversal is noted in xD = 1.

