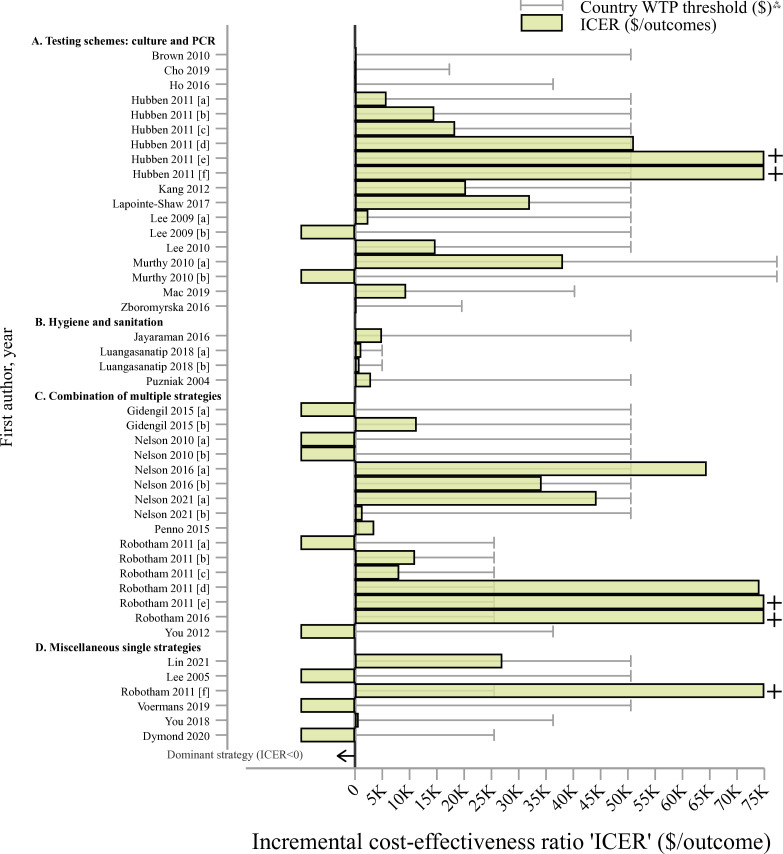
Figure 4.
Incremental cost-effectiveness ratios and willingness-to-pay country thresholds among non-pharmaceutical interventions (in 2022 US dollars, ‘$’), by study†. Notes: †Studies with letters in brackets (eg, (a)) indicate different strategy evaluations, detailed in online supplemental table SM6 under the strategy column. K=thousands or 1000 units. Interpretation of the incremental cost-effectiveness ratio ‘ICER’ should be taken with caution as outcomes (eg, deaths averted, cured patients, quality-adjusted life years ‘QALYs’) used to calculate ICERs varied from study to study. Online supplemental table SM6 contains detailed information by study and outcomes used. ⁂WTP thresholds were extracted from country estimates provided by Woods et al 22 and adjusted to 2022 US dollars. A dominant strategy means that interventions is more effective and less costly (ICER<0). + ICERs were capped at US$75 000 but values are higher (see online supplemental table SM6). PCR, PCR chain reaction; ‘vs’, versus; WTP, willingness-to-pay.

