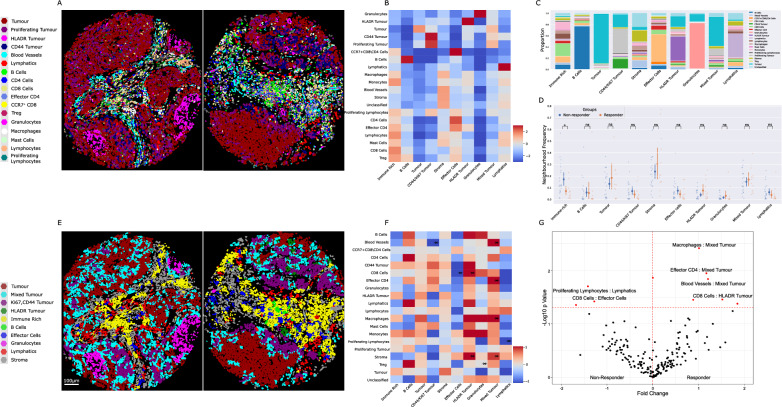
Fig. 5.
Cellular neighbourhoods and their cell type enrichment. A Representative images of cell types in tissue cores. B Cell types were clustered into unsupervised cellular neighbourhoods according to their nearest neighbours. Heatmap shows abundance of cell types in each neighbourhood C Proportion of cell types in each cellular neighbourhood. D Frequency of each neighbourhood in tissue cores was asessed and compared by T test between patient response groups. E Representive images of cellular neighbourhood composition in matched cores to A. F Differential enrichment of cell types in each neighbourhood by response groups were performed. Heatmap shows scaled change of cell types in each neighbourhood by patient response groups. G Volcano plot showing fold change of significant changes in cell type enrichment in each neighbourhood. Significant results p < 0.05 in volcano shown in red. Not adjusted for multiple testing

