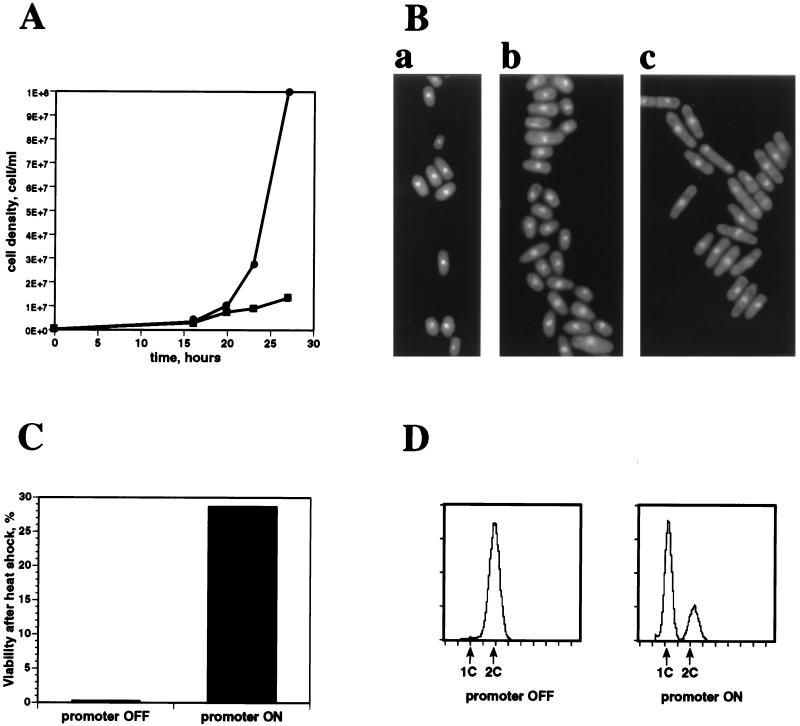
FIG. 1.
Phenotypes of cells overexpressing fnx1 in EMM. (A) Growth curve of cells with derepressed (■) or repressed (•) expression from pREP1-fnx1 showing the growth inhibition upon fnx1+ overexpression. (B) Cells stained with DAPI: a, wild-type cells starved of nitrogen; b, pREP1-fnx1 transformed cells with derepressed promoter; c, pREP1-fnx1 transformed cells with repressed promoter. (C) Heat shock resistance of pREP1-fnx1+ transformed cells with repressed (promoter OFF) or derepressed (promoter ON) fnx1+ overexpression measured as efficiency of plating before and after treatment of a culture of 2 × 10⁶ cells/ml at 48°C for 20 min. (D) Flow cytometric analysis of the DNA content of pREP1-fnx1 transformed cells with repressed (promoter OFF) or derepressed (promoter ON) fnx1+ overexpression shows the presence of a prominent 1C DNA peak when the promoter is induced.

