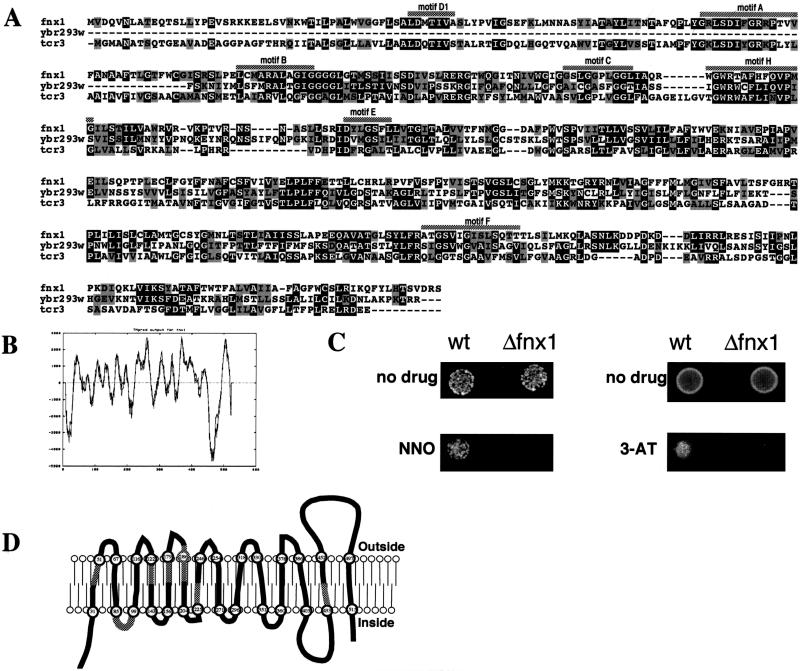
FIG. 4.
Sequence analysis of fnx1. (A) A sequence alignment between fnx1, a closely related ORF from S. cerevisiae Ybr293w (16), and the tcrC gene product of Streptomyces aureofaciens (7) was generated by using the Clustal algorithm (51). Black boxes represent identities, and gray boxes represent conservative substitutions. The MFS-MDR signature motifs (42) are marked with shaded bars above the sequence. (B) Output of the TMpred program for fnx1. The graph plots the probability of a transmembrane domain with the amino acid position. (C) Sensitivity of Δfnx1 cells to 3-amino-1,2,4-triazole and 4-nitroquinoline N-oxide. On the left, 5 × 10² wild-type or Δfnx1 cells were spotted onto EMM or EMM containing 1 μM 4-nitroquinoline N-oxide. On the right, 5 × 10⁴ wild-type or Δfnx1 cells were spotted onto EMM or EMM containing 25 mM 3-amino-1,2,4-triazole. (D) Schematic representation of the transmembrane regions of fnx1 as predicted with TMpred. The numbers in the circles denote amino acid positions. The shaded areas represent the position of the respective MFS-MDR signature motifs.

