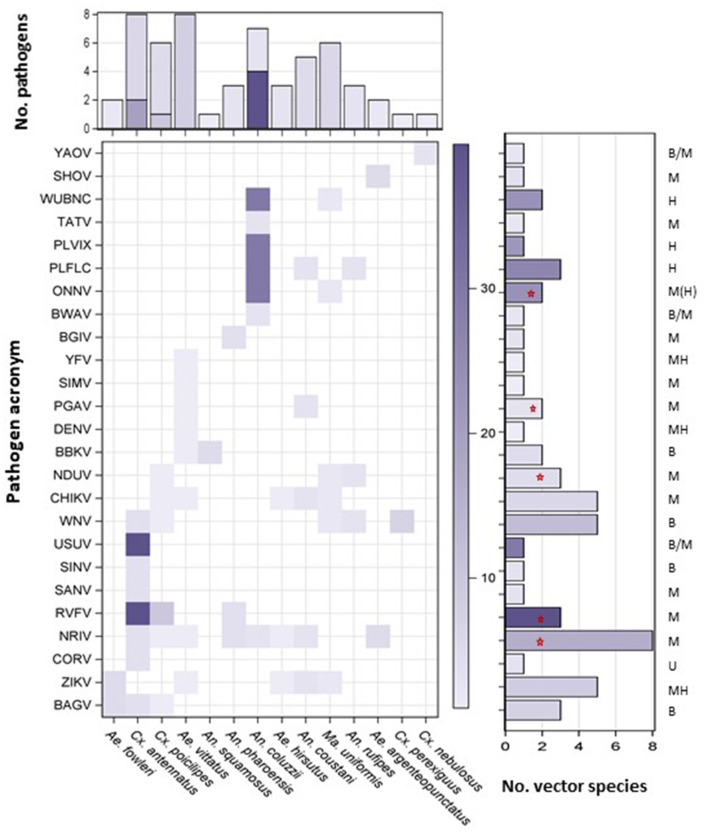
Figure 4.
Risk of disease spread by windborne mosquitoes. A heatmap showing pathogen (Y-axis, pathogen acronym, see Supplementary Table S3) and vector combinations with weight given by the product of vector importance (primary vs. secondary) and aerial abundance (see text). Vertical bars show the number of diseases reportedly transmitted by each vector, either as primary or secondary vector with the total risk weight (color intensity, see text). Horizontal bars show the number of reported vectors of each pathogen, either as primary or secondary vector with the total risk weight (color intensity, see text) for each pathogen. Pathogens circulating between humans (H), mammals (M), birds (B), or unknown (U) natural hosts are listed above horizonal bars (M > B denotes mostly mammals but some indication of birds; B/M indicates evidence for both without clear ranking; MH indicates that wild mammals are reservoir hosts but human to human transmission by vector can sustain human infection over several years, M(H) denotes that human-to-human transmission occurs rarely). Red stars indicate MBPs of highest risk for being primarily affected by windborne mosquitoes (see text).

