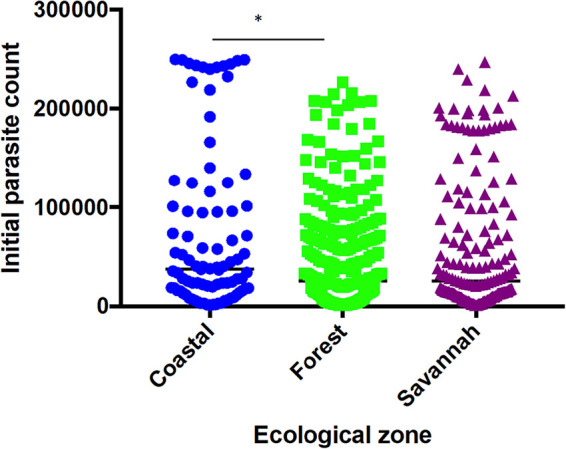
Figure 2.

Parasite densities of study participants at the sentinel sites located in the three ecological zones. Each dot represents the parasite density determined per patient. There was a significant difference in parasite densities of participants from the coastal and forest zones, p ≤ 0.05 (*) using Dunn's test.
