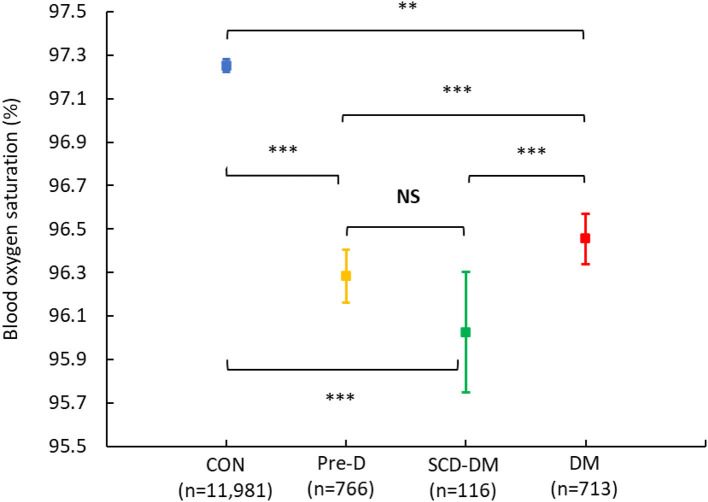
Figure 2.
Blood oxygen saturation in sub-groups. Shown are means with 95% confidence intervals in blood oxygen saturation in participants without diabetes and pre-diabetes (CON; blue), with pre-diabetes (Pre-D; yellow), with screen-detected diabetes (SCD-DM; green), and with known diabetes (DM; red). P-values for between-group comparisons are calculated with the use of a linear regression analysis with diabetes-group (Non-DM; Pre-D; SCD-DM; DM) as the exposure and blood oxygen saturation as the outcome. NS, non-significant (unadjusted). **Significant after adjustment for age, gender, and smoking. ***Significant after adjustment for age, gender, smoking and body mass index (BMI).

