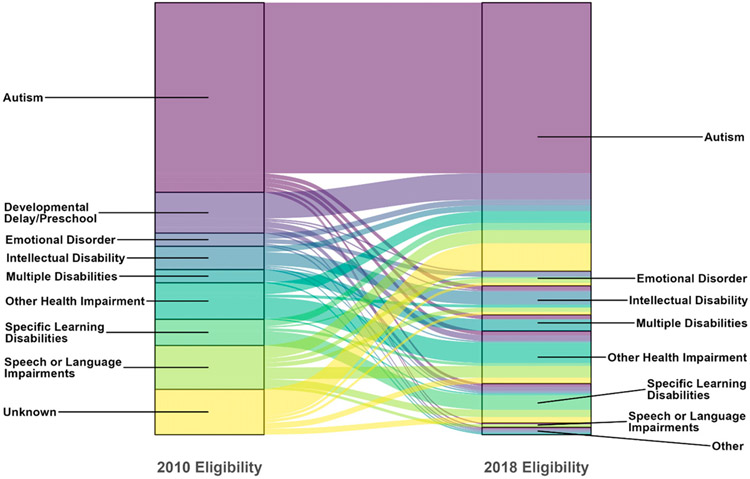
FIGURE 3.
Changes in special education classifications from 2010 to 2018. The alluvial diagram represents the change in special education classifications (eligibilities) from 2010 (age 8 years) to 2018 (age 16 years). The height of each eligibility category is proportional to the number of adolescents represented in that category. In 2018, color patterns within a current 2018 eligibility represent the prior eligibility in 2010. The percentage of adolescents with autism eligibility increased from 44% in 2010 and 62% in 2018. The figure excludes 1 adolescent with a traumatic brain injury eligibility in 2010 and in 2018.

