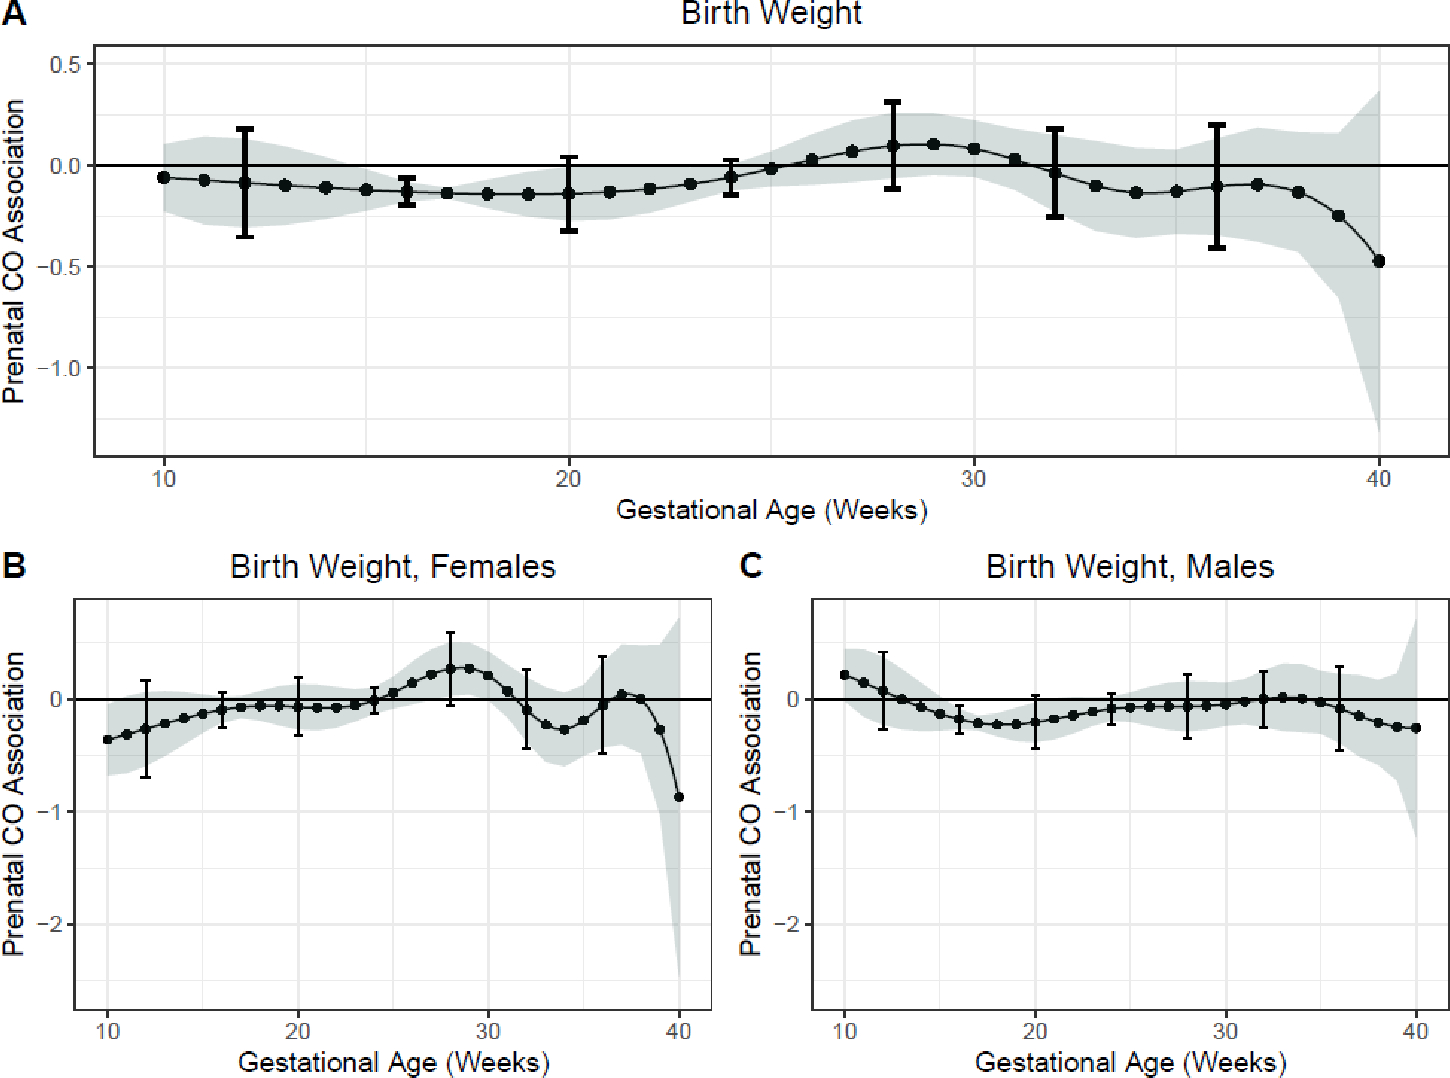
Figure 1. Time-varying associations between prenatal household air pollution exposure, as indexed by personal carbon monoxide, and newborn birth weight in A) all children and B) females and C) males.

This figure demonstrates the association between carbon monoxide exposure measurements over pregnancy and newborn birth weight measured within 24-hours of life assuming week-specific effects for the overall sample. Models were adjusted for child sex; maternal age, body mass index, ethnicity and parity at enrollment; household wealth index; number of antenatal visits; and evidence of placental malaria. The Y-axis represents the time-varying association between birth weight in kilograms and prenatal CO exposure; the X-axis depicts gestational age in weeks. The solid line shows the predicted estimate and the shaded area represents the 95% confidence interval; the brackets demonstrate the Holm-Bonferroni confidence intervals. A sensitive window is identified when the Holm-Bonferroni confidence intervals do not include zero.
