
Fig. 3.
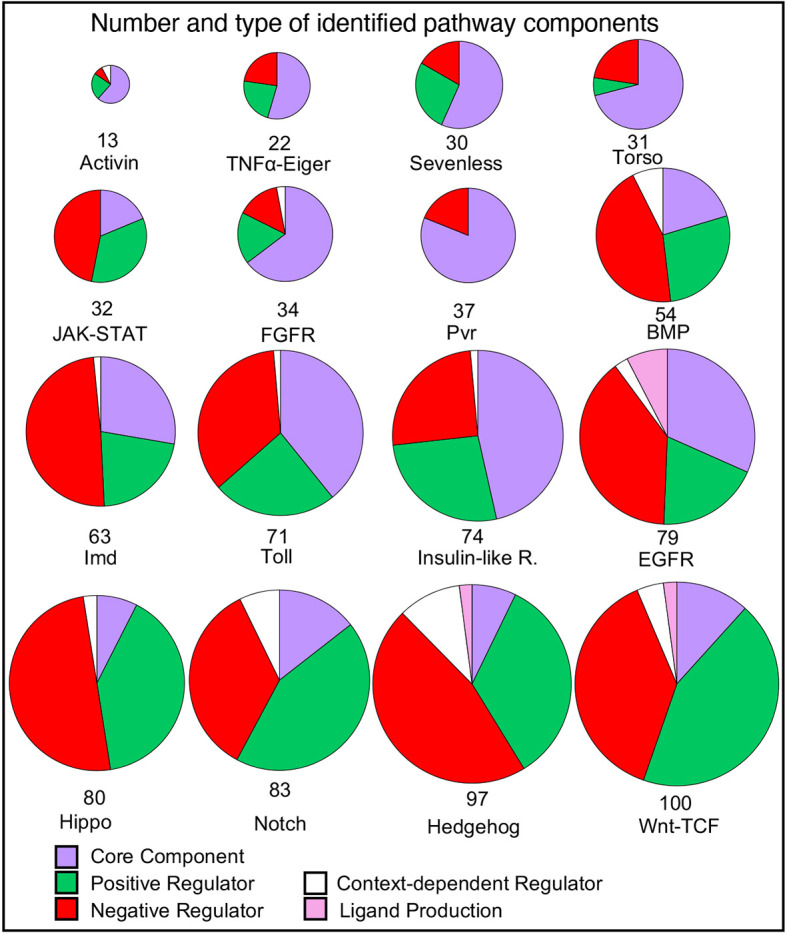
Distribution of types of components in each pathway. The number of genes associated by GO annotations for each pathway are illustrated as pie charts. Each pie chart is broken down into the categories indicated by the key. The total number of genes in the pathway is illustrated by the diameter of the circle and the number at the base. The pathways are ordered by the number of component genes. Where genes have different regulatory effects in different contexts, they are classed as context-dependent regulators. Note that for this figure, in the Toll signaling pathway, which has a more complex extracellular activation cascade, those genes annotated to ‘negative regulation of Toll receptor ligand protein activation cascade’ (GO:0160035) are included in the ‘Negative Regulator’ category and genes annotated to ‘Toll receptor ligand protein activation cascade’ (GO:0160032) are included in the ‘Core Component’ category.