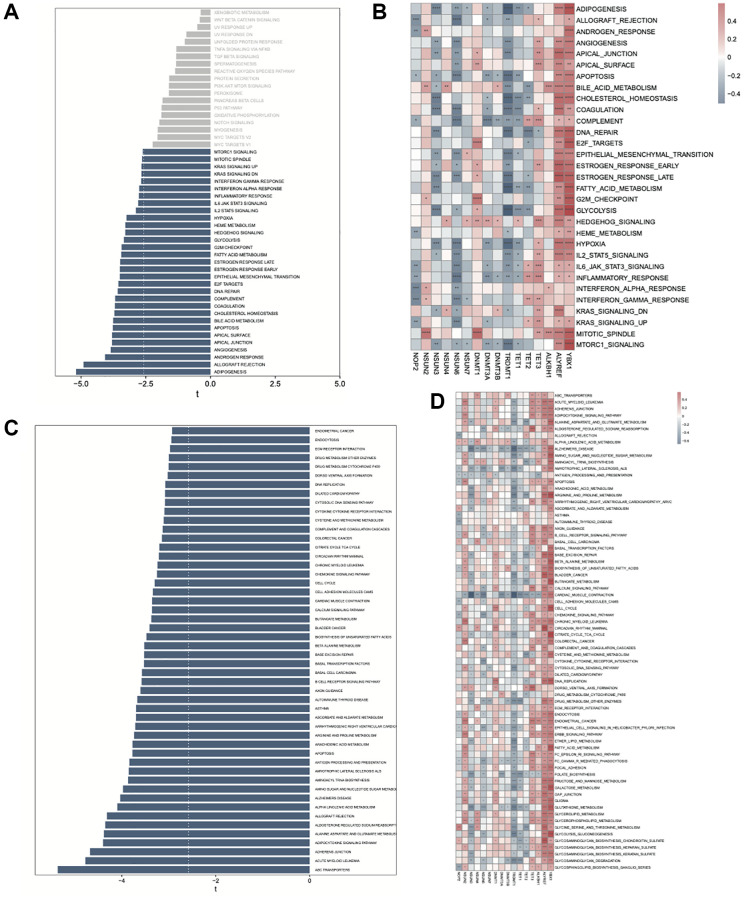
Figure 10.
GSVA analysis between high- and low-risk AML groups. (A) Enrichment of hallmark pathways between high- and low-risk groups. (B) Correlation between the hallmark pathway scores enriched in high-risk group and m5C regulators. (C) Enrichment of KEGG pathways between high- and low-risk groups. (D) Correlation between the KEGG pathway scores enriched in high-risk group and m5C regulators.

