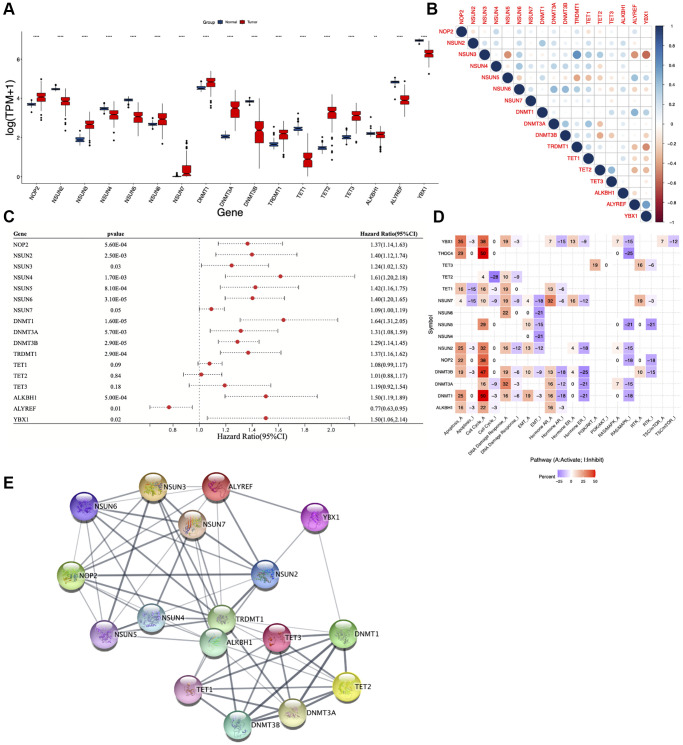
Figure 2.
Expression, correlation, and function of m5C regulators. (A) Boxplot showing differential expression of m5C regulators in AML and normal samples. (B) Pearson correlation analysis, (C) univariate Cox regression analysis, (D) pathway activity analysis and (E) protein-protein interaction (PPI) analysis of m5C regulators. *p < 0.05, **p < 0.01, ***p < 0.001.

