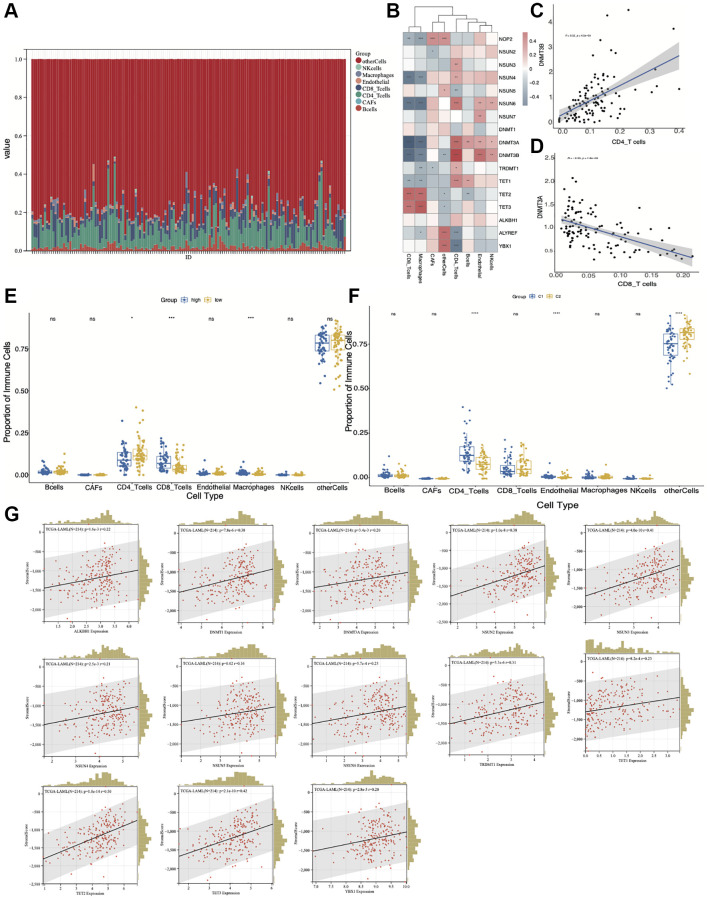
Figure 8.
Correlation of the immune cell infiltration with high- and low-risk groups and m5C regulators-based subtypes. (A) The proportion of immune cells by EPIC algorithm. (B) The correlation between m5C regulators and different immune cell types. (C) DNMT3B is positively correlated with CD4 T-cells. (D) DNMT3A is negatively correlated with CD8 T-cells. (E) Differential infiltration of immune cell types between low- and high-risk groups. (F) Differential infiltration of immune cell types between C1 and C2 groups. (G) Correlation between m5C regulators and stromal score. *p < 0.05, **p < 0.01, ***p < 0.001.

