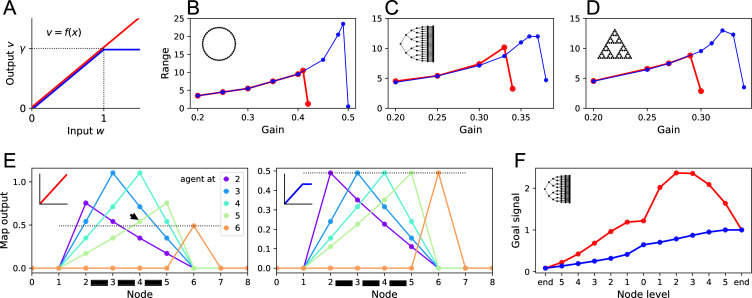
Figure 7. Benefits of a nonlinear activation function.

(A) The activation function relating a map neuron’s output to its total input . Red: linear function with gain . Blue: nonlinear function with saturation at . (B–D) Range of the goal signal, as defined in Figure 6, as a function of the gain (noise ). Range increases with gain up to a maximal value. The maximal range achieved is higher with nonlinear activation (blue) than linear activation (red). Results for the ring graph (B), binary tree maze (C), and Tower of Hanoi graph (D). (E) Output of map cells during early exploration of the ring graph (gain ). Suppose the agent has walked back and forth between nodes 2 and 5, so all their corresponding map synapses are established (black bars). Then the agent steps to node 6 for the first time (orange). Lines plot the output of the map cells with the agent at locations 2, 3, 4, 5, or 6. Dotted line indicates the maximal possible setting of the threshold in the learning rule. With linear activation (left), a map cell receiving purely recurrent input (4) may produce a signal larger than threshold (arrowhead above the dotted line). Thus, cells 4 and 6 would form an erroneous synapse. With a saturating activation function (right), the map amplitude stays constant throughout learning, and this confound does not happen. (F) The goal signal from an end node of the binary maze, plotted along the path from another end node. Map and goal synapses set to their optimal values assuming full knowledge of the graph and the target (gain ). With linear activation (red), the goal signal has a local maximum, so navigation to the target fails. With a saturating activation function (blue), the goal signal is monotonic and leads the agent to the target.
